Via International Man
by David Stockman
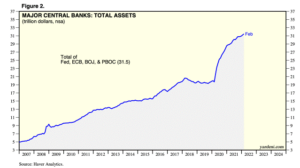
Here is the combined balance sheet for the four most important central banks in the world: the Fed, the European Central Bank (ECB), the Bank of Japan (BOJ) and the People’s Bank of China (PBOC).
On the eve of the great financial crisis in 2007, their combined balance sheets stood at just $5 trillion. Today the figure is $31.5 trillion.
Need we say more?
The red line in the chart below shows the recent parabolic rise of the inflation rate in the eurozone. By contrast, the blue dotted line represents the ECB’s wisdom from just three months ago about where inflation was headed, while the solid blue line reflects its current wishful thinking. To wit, that inflation will be back in the sacred 2.00% box by next year.
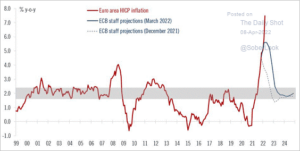
We’d say, “Good luck with that!”
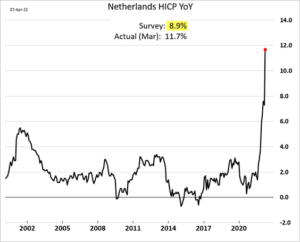
For want of doubt, here’s the recent inflation explosion in the sober Dutch economy. At 11.7% in the recent month, the Y/Y rate has just plain gone vertical. And that doesn’t yet include the full effect of NATO’s madcap Sanctions War against the world’s largest commodity producer, Russia.
Still, what did these cats expect after running the printing presses like there was no tomorrow for the better part of two decades?
As shown below, the ECB’s balance sheet first crossed the €1.0 trillion mark in October 2005 but now stands at €8.7 trillion.
Balance Sheet of the ECB, 2005–2022
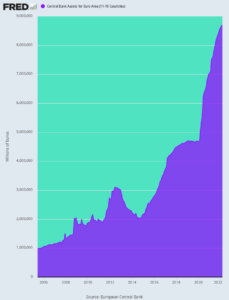
That’s reflective of a 14.1% annualized growth rate year in and year out for 16.5 years running. Yet all the while, like their Fed kinsmen, they have been squawking about “lowflation.”
Never has an agency of the state been so drastically wrong as the leading central banks for the entirety of this century to date. They now have the world flooded with excess demand just as the artificial and unsustainable China-based supply chain, which temporarily facilitated the appearance of low inflation, has come totally unstuck.
For want of doubt, here is the nominal and real GDP in the eurozone for the same 16-year period. Rather than the ECB’s 8,700% gain from its starting level, nominal GDP is up by only 49% and real GDP is higher by a mere 17%. In annualized growth terms, that computes to some pretty tepid figures: 2.48% and 1.00%, respectively, for nominal and real GDP.
Nominal and Real Eurozone GDP, 2005–2021
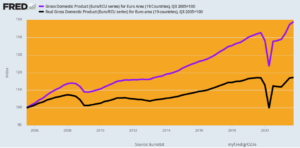
That’s right. A 14.1% growth rate of the ECB’s balance sheet resulted in nominal GDP growth that was less than one-fifth of that magnitude and a real output expansion rate that amounted to just 7% of the growth rate of central bank credit.
Stated differently, in Q3 2005, the ECB’s balance sheet stood at an already frisky 11.8% of eurozone nominal GDP, but it now weighs in at a lunatic 69% of nominal GDP.
“What were these people thinking?” is surely the question of the hour.
Then again, no one can hold a candle to the BOJ when it comes to fruitless money printing. Since the latter revved up its printing presses to hyper-drive earlier than the Fed and ECB, we display a period beginning in Q2 1998 below.
Change in Japan’s Nominal and Real GDP Versus BOJ’s Balance Sheet Since Q2 1998
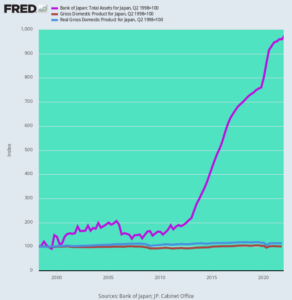
Here are the compound annual growth rates for that 23.5-year interval:
- BOJ Balance Sheet: 1%;
- Japan Nominal GDP:05%;
- Japan Real GDP: 6%.
You can’t make this up. During the past nearly quarter of a century, the BOJ’s balance sheet (purple line in the chart above) has grown 202 times faster than Japan’s nominal GDP (brown line)!
Not surprisingly, this vast disconnect has caused the BOJ’s balance sheet to soar to ¥570 trillion, which is 106% of Japan’s ¥540 trillion of nominal GDP. Getting there, of course, required absorbing huge amounts of Japan’s ginormous public debt.
Currently, that debt stands at ¥1.22 quadrillion — yes, that’s quadrillion with a Q. It amounts to 227% of GDP and is manageable only because the BOJ has monetized more than 44% of the total, while as a practical matter the ministry of finance forces banks, insurance companies and pensions to absorb most of the rest, notwithstanding microscopic yields.
Yield on 10-Year Japanese Government Bond, 1989–2022
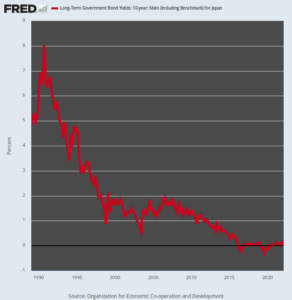
The major central banks of the world have been in a race to the bottom — a dynamic that causes all kinds of derivative financial and economic dislocations.
At the end of the day, the major central banks of the world have printed themselves into a hellacious corner. The four major central banks — the Fed, ECB, BOJ and PBOC —now have $31.1 trillion of asset footings today, compared to just $5.0 trillion at the end of 2006; and when you add the lesser central banks, the combined balance sheets exceed $35 trillion.
Stated differently, the central banks of the world have printed upwards of $30 trillion in fiat credits during the last 16 years, with the Fed leading the way. And yet the knuckleheads who run them have been surprised by the eruption of inflation in recent months and quarters.
Trending:
Views: 5

