

The stock market, as measured by the S&P 500 Index SPX, -0.35%, has traded within a small range — these days, 100 points is a small range — in a volatile fashion since May 27.
That range is roughly 4070 to 4170 points. A breakout in either direction would likely generate follow-through.
There has been some deterioration of the internal indicators while SPX has been in this range, but not a lot. The range is marked with a red square on the accompanying SPX chart. A breakout to the upside could reach 4300, where there is not only resistance from early May, but that is also where the +4σ “modified Bollinger Band” (mBB) has descended to. A breakdown should find support in the 3800-3900 area — the lows of this year.
It should be noted that this range and its potential breakouts do not constitute a change of trend. The trend is still bearish, as noted by the blue lines on the SPX chart. This current rally and trading range fall within the general category of “oversold rally” and not “change of trend.”
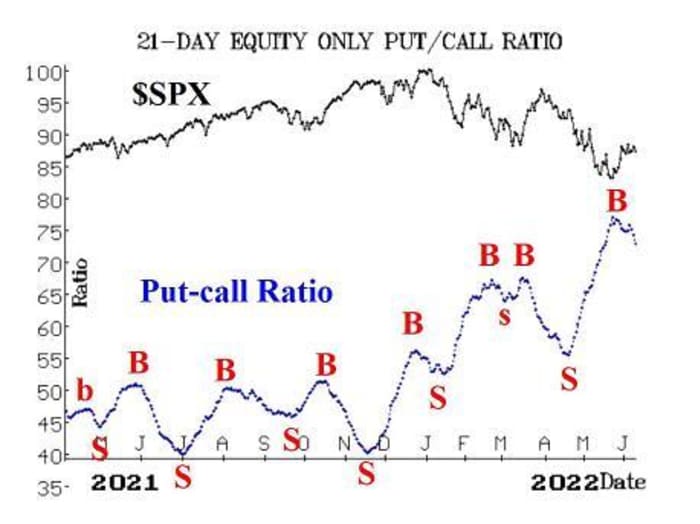
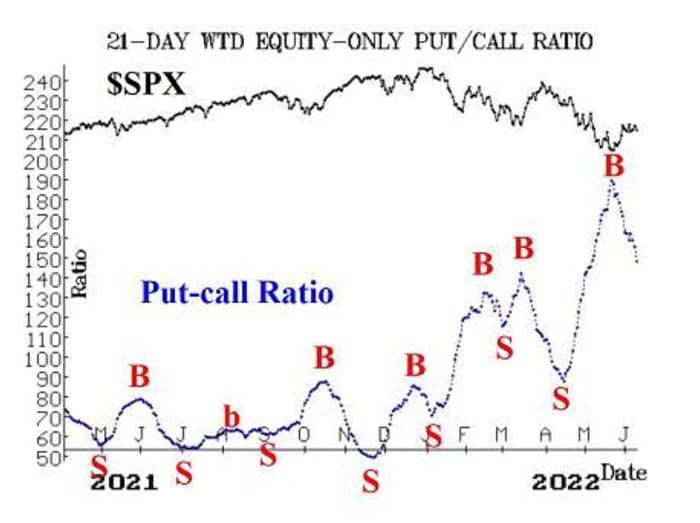
The equity-only put-call ratios remain on buy signals. There was a certain amount of sideways movement on the charts recently, and they even curled upward a bit.
However, the computer programs that we use to analyze these charts were steadfast in their prediction that the buy signals would persevere, and they have. Now the ratios are making new relative lows and dropping more rapidly again. As long as that is the case, it is bullish for stocks.
Breadth had been spectacular at the beginning of the oversold rally in late May, but it has been unable to sustain itself. As a result, the NYSE breadth oscillator has fallen back to a sell signal.
However, “stocks only” breadth has been a little better and is still clinging to a buy signal. The two won’t diverge for long. In any case, breadth has deteriorated while SPX has been in this tight 100-point trading range.
The NYSE’s new 52-week highs have been outnumbering new 52-week lows for the past nine days in a row, beginning May 26.
However, the absolute number of new highs has not yet exceeded 100 on any day. So, the improvement in this indicator is as a result of new lows dropping to nearly nothing, but that alone is not enough for a buy signal. We need to see new highs rise above 100 for two consecutive days in order generate a buy signal. This indicator remains in a neutral status for stocks.
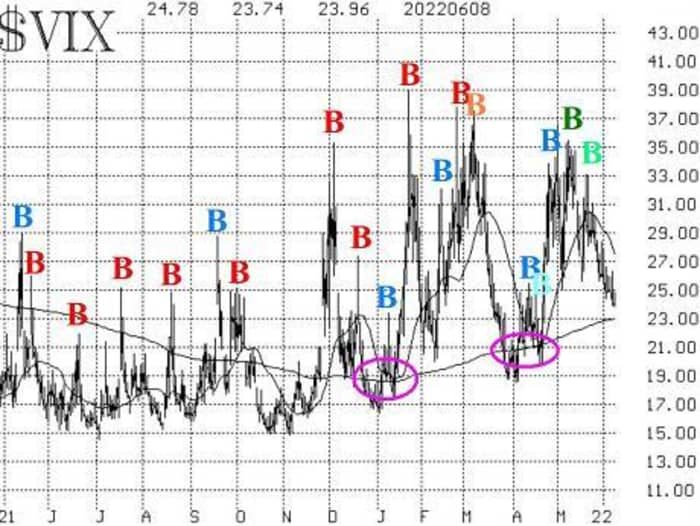
VIX VIX, +0.75% has generally declined while SPX has been in the trading range. The “spike peak” buy signal of May 12 is still in effect. It lasts for 22 trading days (until June 14) unless stopped out by VIX returning to “spiking” mode.
Conversely, the trend of VIX remains upward. That is, both VIX and its 20-day moving average (MA) are above the rising 200-day MA of VIX.
VIX is nearing the 200-day, though, as VIX is just below 24 and the 200-day is at 23. The two oval areas on the accompanying chart of VIX show the last two times that VIX probed below the 200-day. Both times, the 20-day MA of VIX failed to cross below the 200-day, and the bear market resumed shortly thereafter.
The construct of volatility derivatives remains modestly positive in its outlook for stocks. That is, the term structure of the VIX futures slopes slightly upwards — out through October — and the CBOE Volatility Index term structure slopes upwards as well.
In summary, the major trend of SPX is still down, and the major trend of VIX is still up (although it’s beginning to come into question).
That is enough for us to maintain a “core” bearish position. We are trading confirmed short-term signals from the other indicators around that core position.
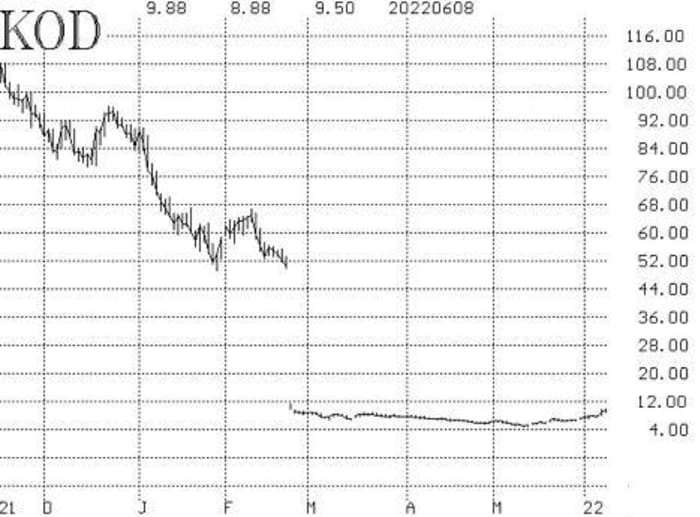
New recommendation: Kodiak Sciences (KOD)
We were not able to buy the calls last week at our limit. KOD had strong option volume and then bolted higher on June 7 after a shareholder bought another 572,000 shares, bringing his total to 16 million shares. We are adjusting the recommendation as follows:
Buy 5 KOD July (15th) 10 calls
At a price of 1.00 or less.
KOD: 9.48 July (15th) 10 calls: 0.75 bid, offered at 0.95
We will hold without a stop, initially.
New recommendation: SPY straddle buy
The conditional buy signal that we had in place for a couple of weeks, based on NYSE New 52-week Highs vs. New 52-week Lows did not meet our criteria, and we are now canceling that recommendation.
Instead, we are going to position for the breakout from the SPX trading range. SPY straddles are not cheap, but realized volatility of SPY remains higher than VIX, so by that measure a straddle purchase is statistically viable.
Buy 2 SPY July (15th) at-the-money calls and Buy 2 at-the-money puts (i.e., buy 2 straddles)
As follow-up, use these guidelines:
- if SPX closes above 4170, then sell off the SPY puts in the straddle
- if SPX closes below 4070, then sell off the SPY calls in the straddle
In the case of a false breakout and reversal, those two instructions would get you out of the whole position, but we are looking for SPX to follow through on its breakout. In the case of a continuation, we will look to roll the profitable side of the straddle on a follow-through move by SPX. Those instructions will be given in the weekly letter.
Follow-up action:
All stops are mental closing stops unless otherwise noted.
We are going to implement a “standard” rolling procedure for our SPY spreads: in any vertical bull or bear spread, if the underlying hits the short strike, then roll the entire spread. That would be roll up in the case of a call bull spread, or roll down in the case of a bear put spread. Stay in the same expiration, and keep the distance between the strikes the same unless otherwise instructed.
Long 2 SPY June (17th) 389 puts and Short 2 SPY June (17th) 364 puts: we originally bought this spread in line with the sell signal from the trend of VIX. It was rolled down whePY traded at 401 on May 9th and then rolled down and out at May expiration. This is our “core” bearish position. We will stop this position out if VIX falls below its 200-day Moving Average, which is currently rising towards 23.
Long 1 SPY June (17th) 412 call and short 1 June (17th) 432 calls: VIX confirmed a “spike peak” buy signal at the close of trading on May 12th, and we bought a call bull spread. That spread had a high strike of 412, so per the standing instructions above, it was rolled up on May 27th, when SPY traded at 412. We are now going to use a VIX “return to spiking mode” as the stop. That is, stop yourself out if VIX closes at least 3.00 points higher over any 1-, 2-, or 3-day period. At this point in time, the lowest recent VIX closing price is 23.96 on June 8th. So, the current stop is a VIX close at 26.96 or higher. Moreover, this system is designed to stay in the trade for 22 trading days, if not stopped out, which means that the last day would be next Tuesday, June 14th.
Long 3 BKI June (17th) 70 calls: continue to hold while the spread in this deal remains wide. The deal is 63.20 + 0.2 * ICE, which is worth $83.47 with ICE trading at 101.39. BKI is trading at 67.60, so the spread remains wide. Continue to hold.
Long 5 MX Jun (17th) 20 calls: continue to hold while the rumors play out.
Long 2 SPY July (1st) 402 calls and Short 2 SPY July (1st) 417 calls: this spread was originally bought on May 26th, based on the combination of new equity-only put-call ratio buy signals and breadth buy signals. It was then rolled up on June 2nd, when SPY traded at the high strike in the spread.
The breadth oscillators have fallen back to sell signals, so sell half the position now. We will close the other half when the equity-only put-call ratios roll over to a sell signal.
Long 2 EA June (17th) 137 calls: we bought these calls on May 27th, because that was the first day that they traded at our limit of 5.00. We will hold without a stop for now.
Send questions to: lmcmillan@optionstrategist.com.
Lawrence G. McMillan is president of McMillan Analysis, a registered investment and commodity trading advisor. McMillan may hold positions in securities recommended in this report, both personally and in client accounts. He is an experienced trader and money manager and is the author of the best-selling book, Options as a Strategic Investment.
Disclaimer: ©McMillan Analysis Corporation is registered with the SEC as an investment advisor and with the CFTC as a commodity trading advisor. The information in this newsletter has been carefully compiled from sources believed to be reliable, but accuracy and completeness are not guaranteed. The officers or directors of McMillan Analysis Corporation, or accounts managed by such persons may have positions in the securities recommended in the advisory.