By Graham Summers, MBA
Stocks are currently in a bear market. The average bear market is 9 months long and sees stocks lose 30%.
Thus far this bear market is six months old, and stocks are down just 21%. So, the issue is determining just how much further we have to go.
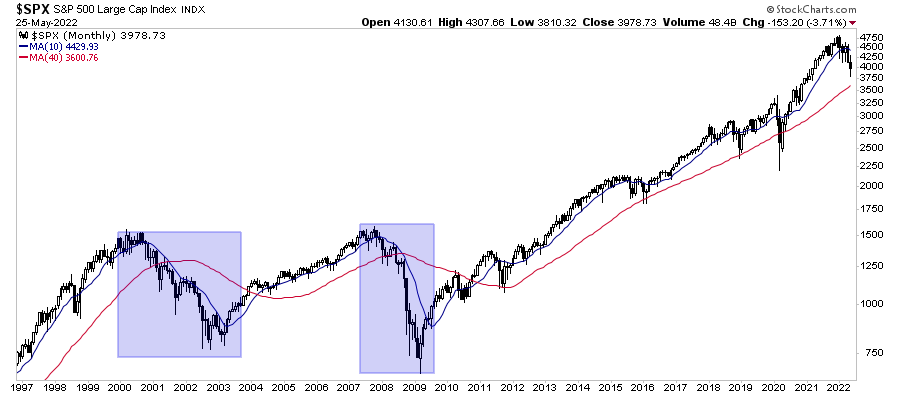
As I’ve mentioned previously, at the very least we can expect this bear market to see the S&P 500 break down to touch its 40-month moving average (this is the same thing as the 200-week moving average). The 40-MMA is illustrated by the red line in the chart below.
The bigger question is what happens there.
During the COVID-19 crash, the Fed moved to support the entire financial system. That is the only thing that stopped stocks from entering a full-scale crisis.
During a full-scale crisis, the S&P 500 usually breaks its 40-MMA and then wipes out almost the entirety of the previous bull market’s gains. I’ve illustrated this with blue rectangles in the chart below.

A similar move this time around would mean the S&P 500 falling to at least 1,750.
Will this happen? It’s certainly possible. As I mentioned a moment ago, the only thing that pulled the market back from the brink in 2020 was the Fed moving to ease monetary conditions in an extraordinary way.
This time around, the Fed is trying to tackle inflation… so easing would only worsen the problem! The Fed has only raised rates to 1% and will begin shrinking its balance sheet on June 15th… and stocks have already lost 20% of their value.
What happens when the Fed is forced to raise rates to FIVE percent or more. What happens when it tries to shrink its nine TRILLION dollar balance sheet by $1+ trillion.
You get the idea.
The Mother of All Collapses is coming!
Trending:
Views: 0

