By Wolf Richter, editor of Wolf Street. Originally published at Wolf Street
People want to get on with their lives, it seems. Their mood has improved. They’ve gotten used to living with high inflation. They got raises or got higher-paying jobs. Gasoline prices have plunged since the peak in mid-2022, and that matters a lot because it’s the most in-your-face inflation along with food inflation. They might still gripe about higher prices, but you live only once?
And so they spent money left and right in January, and they outspent even this raging inflation. We already saw surprising strength from new and used vehicle sales coming out of the auto industry, and from the retailers’ point of view earlier this month, which showed that consumers were in no mood for a landing.
Today, we got inflation-adjusted (or “real”) consumer spending trends for January from the Bureau of Economic Analysis. Personal Consumption Expenditures (PCE) on durable goods, nondurable goods, and services is adjusted for inflation based on the PCE price index, which blew out.
Spending on services, adjusted for the raging inflation in services, jumped by 0.6% in January from December, seasonally adjusted, and by 4.1% year-over-year (not seasonally adjusted).
Not adjusted for inflation, spending on services spiked by 1.3% from the prior month, and by 10% year-over-year!
Services accounted for 62% of total consumer spending. It includes housing, utilities, insurance of all kinds, healthcare, travel bookings, streaming, software, subscriptions, entertainment, repairs, cleaning services, haircuts, etc.
Certain types of discretionary services – airplane travel, cruises, live entertainment, etc. – got crushed during the pandemic. Revenge spending on some of those services set in some time ago.
Despite the strong growth over the past 12 months, and despite the huge recovery from the knock-out in 2020, spending on services, adjusted for inflation, still hasn’t reverted to pre-pandemic trend:
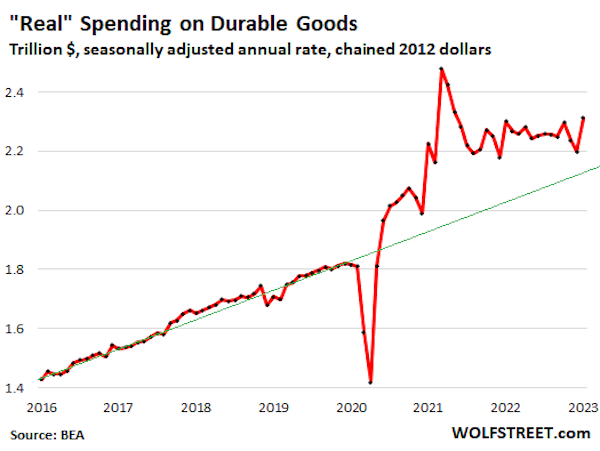
Spending on durable goods, adjusted for inflation, spiked by 5.2% in January, seasonally adjusted. But year-over-year, it was up only 0.5%. The year-over-year figure is key here, and it’s not seasonally adjusted.
I discussed earlier the strength of new and used vehicle sales in January, based on units delivered to end users, that caused used-vehicle wholesale prices to jump again in January and in the first half of February, as dealers bid up prices at the auction to restock their inventories.
After the massively over-stimulated spike during the pandemic, “real” spending on durable goods was supposed revert quickly to the mean, to the pre-pandemic trend, and it did some of that, but nearly two years after the spike, it’s still well above the pre-pandemic trend.

Seasonal adjustments for durable goods in November, December, and January are always huge, as they attempt to iron out the massive spike in spending on durable goods during the holiday season and the plunge in spending in January. These seasonal adjustments are linked. If they’re too aggressive for November and December (pushing seasonally adjusted spending down too far), they’re also too aggressive in January (pushing seasonally adjusted spending up too far), which is what we may be seeing in the above chart.
If you look at the above chart while holding your tongue just right, you can see that spending, adjusted for inflation, roughly flattened out over the past 12 months at very high levels.
This is confirmed by year-over-year spending, adjusted for inflation, but not seasonally adjusted, which ticked up just 0.5% from the very high levels a year ago.
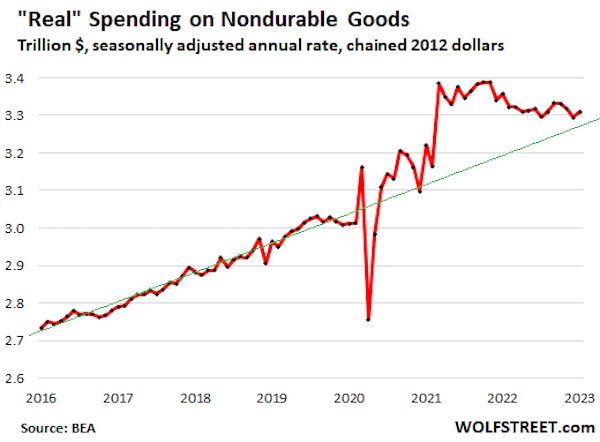
Spending on nondurable goods, adjusted for inflation, rose by 0.5% in January from December, seasonally adjusted, but declined 1.4% from a year ago.
Nondurable goods are dominated by food, energy, and household supplies. We’ve already seen that gasoline consumption, measured in barrels per day, dropped in 2022 in reaction to spiking gas prices. So on an inflation-adjusted basis, consumer spending on gasoline dropped.
Spending on nondurable goods has now nearly reverted to pre-pandemic trend.

The people don’t want this thing to land.
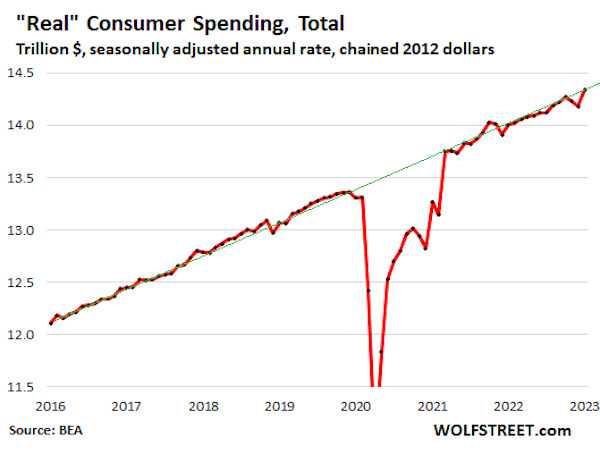
Overall “real” spending growth jumped by 1.1% in January from December, inflation-adjusted and seasonally adjusted.
Year-over-year, not seasonally adjusted, “real” spending grew by 2.4%. In the 10 years before the pandemic, annual growth of “real” spending ranged from +1.4% at the low end (2012) to +3.3% at the high end (2015), and averaged 2.2% over those 10 years.
So the year-over-year growth in January of 2.4%, adjusted for inflation, was just above the 10-year average of 2.2% before the pandemic. This is not the sign of any kind of landing. Clearly, people don’t want this thing to land.
Note the quirks of the seasonal adjustments in the Novembers and Decembers of 2021 and 2022, when seasonal adjustments may have pushed down spending figures too far, and then conversely pushed up spending figures too far in the Januaries of 2022 and 2023. These quirks are largely related to durable goods, as we saw above.
The month-to-month seasonal adjustments, which are based on the history of seasonal swings, have been a little rough since March 2020, when radically different consumer spending patterns distorted everything and threw all historic patterns out the window.
But year-over-year spending growth (+2.4%) is not seasonally adjusted.
And the chart shows the trend – the continued strength of spending growth despite the quirks in Novembers and Decembers (when the media proclaimed the demise of the consumers), and Januaries (when the media proclaimed the resurrection of the consumers), when in fact, these consumers were plodding along just fine, energetically outspending inflation:


