Yves here. Wolf Richter unpacks why the revisions on unemployment stats don’t look untoward or suspicious, but how the hyped up reporting is obviously lousy and agenda-driven. Which is not to say that defaulting to having the Fed be the inflation fire brigade is a good idea.
By Wolf Richter, editor at Wolf Street. Originally published at Wolf Street
Our Favorite Recession Indicator shows next recession keeps moving further out.
This is kind of funny. Initial claims for unemployment insurance fell by 8,000 to 215,000 in the current reporting week, after having fallen by 9,000 in the prior week, according to data the Labor Department this morning.
What’s funny is the headline treatment that the jump two weeks ago (May 9) to 232,000 had received: It was hyped as a sign that the labor market is suddenly weakening, and that the Fed would start cutting rates soon (which we obviously pooh-poohed at the time).
So today, initial unemployment claims were back to the historically low levels that had prevailed for much of the past two years, another sign that the labor market is relatively tight. We take this seriously because the data are an ingredient in our Favorite Recession Indicator (more in a moment):
One of the big reasons why these initial unemployment claims data fluctuate from week to week so much is that this is raw data of unemployment insurance claims that newly laid off people filed with state agencies, and that the state agencies then process and submit by the weekly deadline to the Labor Department.
When they miss the deadline, those claims then go into the next week, which lowers the number of claims in the current week and increases the number of claims in the next week. When Rhode Island does it, no one notices the difference. But when one of the big states does it, it leads to big shifts from one week to the next.
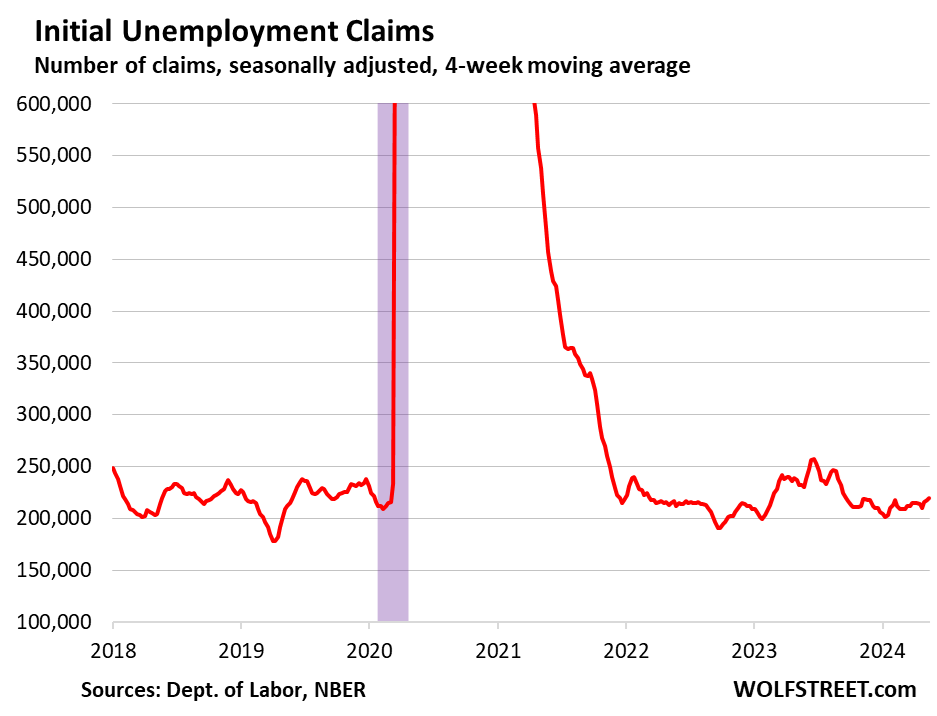
Which is precisely why the Labor Department also releases the four-week moving average, which irons out those shifts between weeks.
On May 9, the four-week moving average of initial claims inched up to 215,000, having been essentially flat at historically low levels, as we pointed out at the time.
Today, the four-week moving average ticked up to 219,750, still at historically low levels. The now vanished little hump between February 2023 and September 2023 was the result of the layoffs in tech and social media:
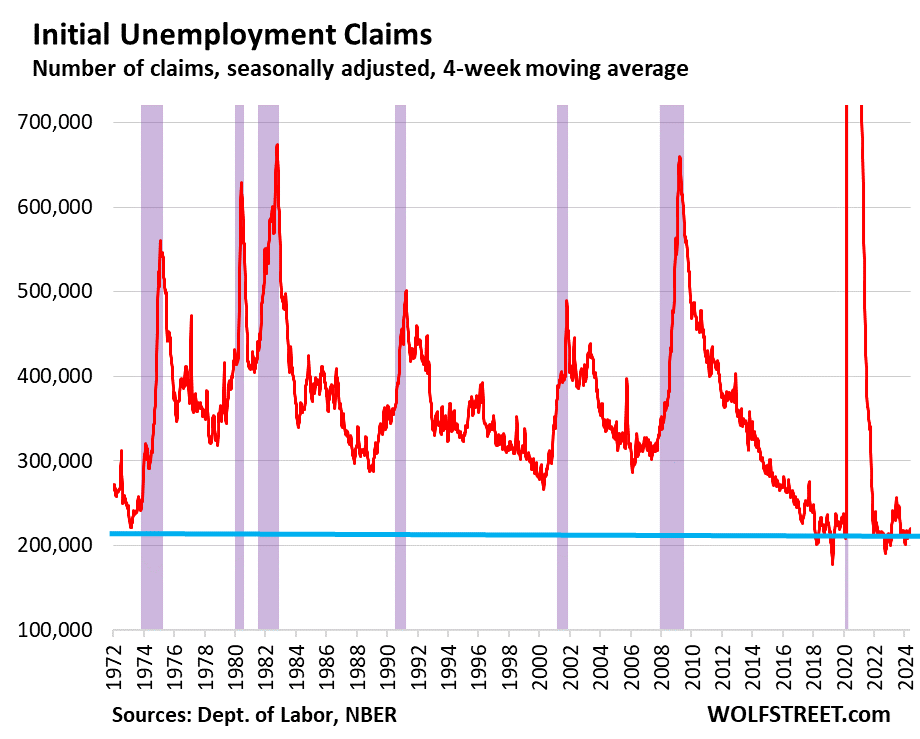
The long-term view (recessions marked in purple) shows just how historically low these initial claims for unemployment insurance are, especially when considering that employment and the labor force have increased over those decades, along with the population:
Our Favorite Recession Indicator
We’ve been on recession-watch here since shortly after the Fed kicked off its rate hikes in March 2022. The National Bureau of Economic Research (NBER), which calls out the US recessions, has always defined them as broad economic downturns that include downturns in the labor market.
So we’re looking for sharp increases in weekly claims for unemployment insurance benefits (charts above), and for sharp increases in continued claims for unemployment insurance (charts below).
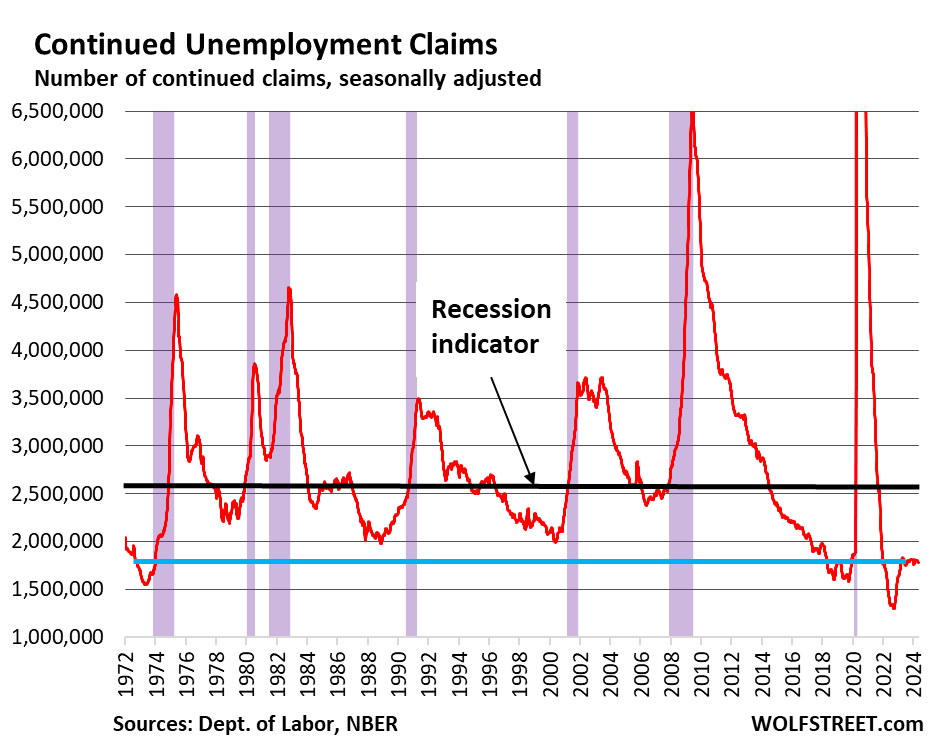
The number of people who are still claiming unemployment insurance benefits at least one week after the initial application – people who haven’t found a job yet – has been in the same relatively low level since mid-2023.
In the current reporting week, 1.79 million people were still claiming unemployment insurance. The four-week moving average has been roughly steady at around 1.78, and down a tad from the levels in December of 1.81 million.
A higher level of continued claims suggests it takes people who lost their jobs a little longer on average to find a new job.
This “frying pan” pattern, as we’ve come to call it, has been cropping up in a lot of economic data, formed by an undershoot coming out of the pandemic, and then a return to normalization:
Our Indicator (Below) Points at an Oncoming Recession When the Blue Line Gets Close to the Black Line
Recessions from the Great Recession back through the early 1980s began when continued claims for unemployment insurance spiked through the 2.6-million mark (black line in the chart below).
Today’s level of 1.79 million (blue line) is far below recessionary levels (black line). It points at a labor market that is among the tightest of the past 50 years and tells us that there is still no recession in sight yet.