Earlier in August, it was reported that 528,000 jobs were created in July after expectations were around 230,000 jobs. Overall, it was a seemingly better jobs report than expected.
However, it’s hard to argue that the overall jobs data is still strong (by historical measures, in most categories, it’s still very strong). But, digging into the data, it’s clear that there is a very negative trend. To put it plainly, things are still good, but it’s getting worse quickly.
Details From The Jobs Report
While it can be challenging to get the exact change in full-time and part-time job holders since the government uses different data points and surveys to determine these numbers, it appears that the number of full-time jobs declined by about 71,000, and the number of part-time jobs increased by about 384,000. The number of people who took a second part-time job increased by about 92,000.
This doesn’t add to the 528,000 total simply because these numbers rely on household surveys instead of employer-reported data. Long story short, many people are picking up part-time jobs to help pay the bills, and a decent number are picking up a second (or third) part-time job. Full-time jobs were reduced in July, which confirms what a lot of people have suspected—there has been a net increase in layoffs.
The Labor Force Participation Rate, the percentage of the population working or looking for work, stands at 62.1%. This is about 1.2% lower than where it was in February 2020 prior to the pandemic.
Labor Force Participation Rate (1948-2022) – St. Louis Federal Reserve
This means we still have several million fewer people working or looking for jobs than we did nearly three years ago. Did they retire? Just taking time off? Are they gig workers? Day traders? Or did they simply give up on trying to find work for the time being? We don’t know, and it’s likely a combination of all these things. This number has been decreasing since March.
Furthermore, just over 300,000 people took part-time work because they needed extra money, either because their hours were cut or because of general economic reasons. These are people who would have preferred full-time work but were unable to find full-time jobs. The increase was about 7% from the preceding month, which is a big jump, but there are only 3.9 million of these workers compared to 4.4 million in February 2020. In other words, we’re seeing more economic instability over time, but we were already heading in that direction pre-Covid.
About 5.9 million people are currently not in the labor force but would like a job. This portion of people were not counted as unemployed because they were not actively looking for jobs or collecting unemployment. This is compared to 5 million people in February 2020. This figure is a result of people who have given up on finding a job that is acceptable to them, or in some cases, people who have determined that it is more lucrative not to work (for example, someone who makes $15/hour but has to pay $15/hour for child care would find that it makes more sense to stay at home than work.)
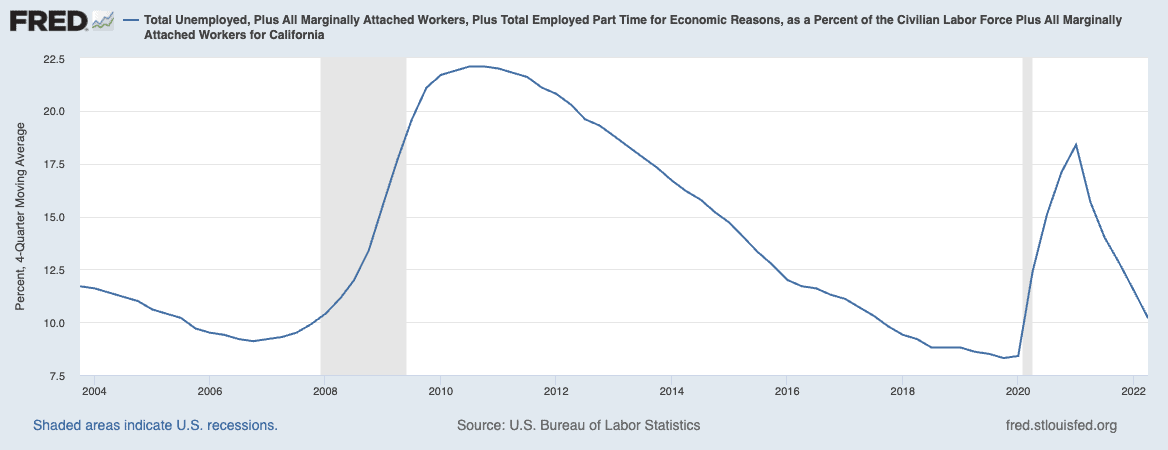
The unemployment rate dropped from 3.6% to 3.5% to match the February 2020 number, but if you add in “marginally attached workers” (which are essentially discouraged workers—those who had looked for a job in the past year but couldn’t find one and stopped looking), the percentage jumps to 10.2% compared to 8.4% back in February 2020. Again, an indication that there are plenty of individuals who want to work but can’t find a job they find suitable, for whatever reason that may be.
 Total Unemployed, Plus All Marginally Attached Workers (2004-2022) – St. Louis Federal Reserve
Credit Data
In addition to the jobs report, here are a couple of other data points around credit availability and usage that tie into the narrative we’re seeing:
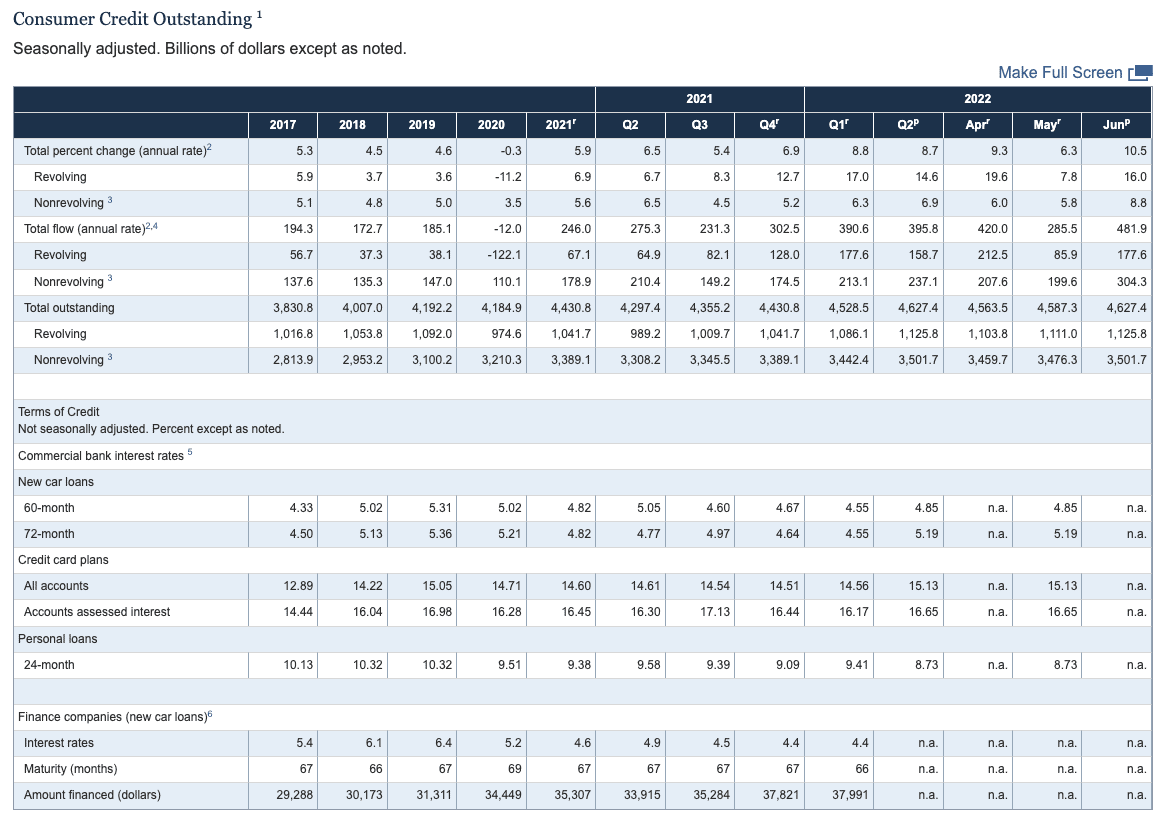
- Available consumer credit increased by more than 10% in June after increasing 6.5% in May. This isn’t the total amount of outstanding debt but the total amount of credit. In other words, people are taking HELOCs, adding credit cards, or increasing credit card limits, even if they’re not yet spending that money. 233 million credit cards were opened in Q2, the most since 2008. People are preparing for additional credit needs.
- In terms of credit owed, that increased 1.3% in June. So, people are borrowing more, not just opening credit lines.
 U.S. Consumer Credit Outstanding (2017-2022) – U.S. Federal Reserve
Final Thoughts
My takeaway from this data is the same as what I suspected last week—we are not yet in a recession, but we’re quickly moving in that direction. Both jobs and credit data indicate a tipping point, and things could move downhill quickly and decisively, despite things still looking pretty decent on the surface.
An economy built on part-time jobs lacks the stability it needs to perform well in the long run. More jobs won’t matter if they don’t offer enough compensation to keep the population afloat.
On The Market is presented by Fundrise

Fundrise is revolutionizing how you invest in real estate.
With direct-access to high-quality real estate investments, Fundrise allows you to build, manage, and grow a portfolio at the touch of a button. Combining innovation with expertise, Fundrise maximizes your long-term return potential and has quickly become America’s largest direct-to-investor real estate investing platform.
Learn more about Fundrise
Note By BiggerPockets: These are opinions written by the author and do not necessarily represent the opinions of BiggerPockets.

