

By Kenneth Rogoff, Thomas D. Cabot Professor of Public Policy and Professor of Economics Harvard University. Originally published at VoxEU.
After decades of building at a breakneck pace, the stock of real estate in China is now quite large for what is still a lower-middle-income country. Studies of the country’s real estate industry tend to focus either on national aggregates or on the largest ‘tier 1’ and ‘tier 2’ cities. This column uses new data to show that China’s ‘tier 3’ cities, which account for more than 60% of its GDP and about 50% of the market value of its housing stock, seem to be the major locus of overbuilding problems that very recently have been spilling into China’s construction companies.
For all the recent attention paid to the outsized share of real estate and construction in China’s GDP, the more fundamental issue is that the sector has been racing ahead for several decades now, so much so that China already has, or is nearing, comparable square meters per capita of housing to many wealthy advanced economies. If real estate investment is running into diminishing returns, the implication is that the sector may need to shrink significantly over the coming decade, potentially exposing vulnerabilities in finance, government revenue, and employment. A fundamental question, however, that has only been touched on in the academic literature, is how the allocation of housing and construction imbalances extends across different regions, and how this might matter for any subsequent adjustment. Regional disparities may also help explain why the apparent health of the real estate sector in the largest and most prominent cities, where the data are easier to obtain, may not be representative of a large fraction of the country.
There have been a number of important papers on China’s real estate industry over the past decade, but they generally focus either on national aggregates, or on the largest ‘tier 1’ and ‘tier 2’ cities (e.g. Fan et al. 2015, Chen and Wen 2017, Glaeser et al. 2017, Chang and Xiong, 2018, Liu and Xiong 2020.) Building on earlier work on China’s growing real estate problems with Yuanchen Yang (Rogoff and Yang, 2021a, 2021b), we develop new data that allows one to analyse imbalances by city tier (Rogoff and Yang 2022). We show that the problems are much more acute in in the generally smaller and lower-income tier 3 cities. Tier 3 city real estate has been much less studied than real estate in the wealthier and more prominent tier 1 and tier 2 cities. Most previous discussion has been largely anecdotal. Nevertheless, China’s tier 3 cities account for more than 60% of its GDP and about 50% of the market value of its housing stock (70% by square meters living space); Tier 3 cities very much seem to be the major locus of overbuilding problems that very recently have been spilling into China’s construction companies.
The problem in China is not simply the size of the real estate sector, which for 2021 has direct value added of 11.8% of GDP but, including direct and indirect final demand, accounts for 25.4%. Obviously, should the real estate demand contract, say, because of slower future growth in China, the knock-on effects to GDP could be quite substantial, depending on how easily resources could be shifted to other sectors. In fact, the larger issue is that after decades of building at a breakneck pace, the stock of real estate in China is now quite large for what is still a lower-middle-income country, with per capita floor space per capita comparable to France and Germany.
The buildup of housing in tier 3 cities, which we show is matched by commercial real estate and infrastructure construction, may have been an attempt to fight Zipf’s law; in most countries, this leads to having the largest cities absorb an outsized fraction of population and economic activity. However, the fact that the tier 3 cities have actually been collectively losing population as the tier 1 and tier 2 cities have still been gaining suggests that the attempt to “build it and they will come” (to quote the 1989 American movie Field of Dreams) has not been successful. Real estate imbalances are so significant that they are likely to weigh on growth even if they do not lead to financial crisis (Rogoff and Yang 2021a), but of course financial stress is a potential multiplier.
Figure 1, based on the annual data of housing stock by city tier we construct, shows the outsized weight of tier 3 cities in construction.
Figure 1 Total housing stock by city tier (million square metres)
Sources: Official website of National Bureau of Statistics of China, China Statistical Yearbook, 2010 Chinese National Census, 2020 Chinese National Census, 2010 Chinese Provincial Censuses.
Notes: The label in the centre of the bar indicates the number for tier 3 cities. The label at above the bar indicates the total number.
Although China does not publish statistics on housing price developments for most tier 3 cities, it does publish price indices for tier 1 and tier 2 cities, as well as for a national average. Making use of our calculations on the size of the housing stock in each of the groupings, we are able to infer price developments in tier 3 cities. As Figure 2 illustrates, recent prices have been much weaker in tier 3 cities compared to, say, the tier 1 cities (Beijing, Shanghai, Shenzhen and Guangzhou), consistent with our observations on demand and supply.
Figure 2 Housing price change by city tier
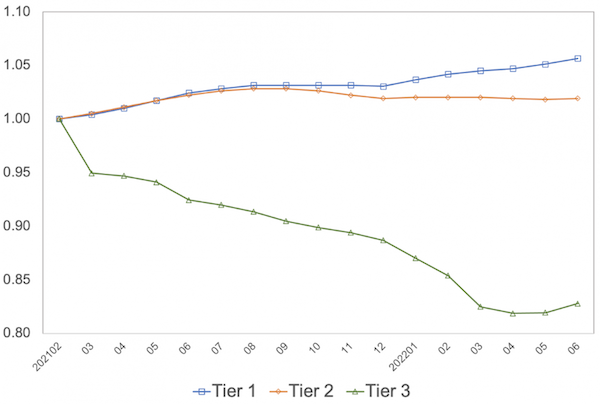
Source: Official website of National Bureau of Statistics of China
Notes: The month of February 2021 is used as the base month and the indices measure cumulative change relative to the base month.
Population outflows, compounded by a rapidly ageing overall population, point to a declining housing demand in the foreseeable future, especially for tier 3 cities. Until now, tier 3 cities have kept adding more homes despite already spacious per capita residential floor space. It is true that the real estate industry can shift away from construction of new homes and office buildings to replacement. In fact, if, following the central UN population projection estimates for China, the demand for new urban housing declines by about 3% annually through 2035, then replacement needs will account for 60% of construction. However, given that much of China’s urban real estate is relatively new, built after 2000, this will still require a considerable downward adjustment in industry size, with knock on effects to the economy.
Figure 3 Population growth by city tier
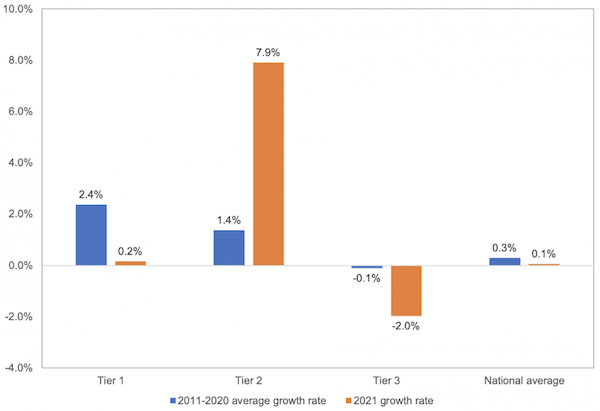
Source: Official website of National Bureau of Statistics of China.
One of the key measures of distress is the number of unfinished construction projects, which has been expanding as demand shrinks and construction firms have difficulty both completing projects that are presold and offloading projects that are not. There has been much discussion of this recently in the press, but Figure 4 gives a concrete quantitative measure – the ratio of housing under construction over housing completed, which reflects the scale of uncompleted buildings relative to the existing building capacity. A typical real estate construction project, which took five to six years to be completed in the early 2010s, would take more than ten years now and run the risk of being left unfinished. As the figure illustrates, the problem is acute not only in tier 3 cities, but also in tier 2 cities.
Figure 4 Housing under construction versus housing completed by city tier
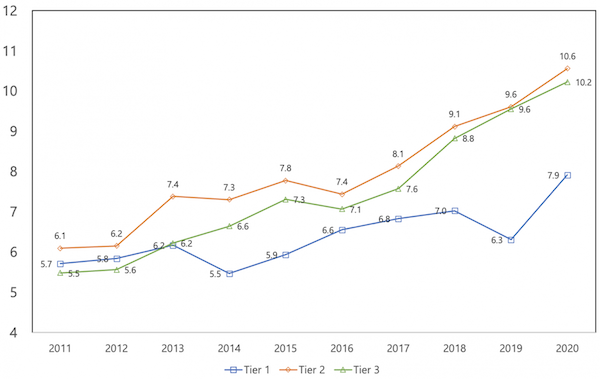
Source: Official website of National Bureau of Statistics of China.
Commercial real estate problems are quite parallel to housing. Although we are not able to produce similarly complete disaggregated data on infrastructure, we do have provided estimates for a number of important subcategories. For example, despite the fact that tier 3 cities account for roughly 60% of national GDP, they account for 88% of all roads and 92% of new road construction; the same is true for pipelines. China famously has the world’s largest high-speed rail system and continues construction at a rate that far exceeds passenger miles, particularly in the large share devoted to tier 3 cities.
All of this helps explain the apparent disconnect that persisted for some time between aggregate estimates suggesting ‘peak China housing’ (Rogoff and Yang 2021), and journalistic accounts of still strong price performance in the large cities. Today, there is much broader understanding that China’s real estate sector is in trouble, but the important point we make here is that epicentre is in the tier 3 cities, which are collectively far more important than is commonly realised. Lastly, although it is true that the Chinese government has enormous leverage over real estate through financial regulation and myriad other instruments, it is wrong to argue the current malaise is simply due to excessive tightening of lending regulations. After the heady days in which construction was at the core of China’s growth strategy, decreasing returns are setting in just as they did for Russia railways and steel plants in the 1970s, and for Japanese infrastructure in the 1980s. Given the many factors pointing to slower long-term Chinese growth, including adverse demographics, excessive centralisation, slowing benefits from catching up with Western technology, not to mention the costs of transition to a low-carbon economy, it appears that a major adjustment is needed in Chinese real estate, particularly in the tier 3 cities.
References available at the original.
