

As investors search for potential signs of investor exhaustion to gauge whether the bear market in U.S. stocks might have more room to run, a team of analysts warned that retail traders likely still have scope to get more negative on stocks.
This in turn may suggest that a full-on market “capitulation” might still lie ahead, even as U.S. stocks extended a rebound on Wednesday from last week’s slump.
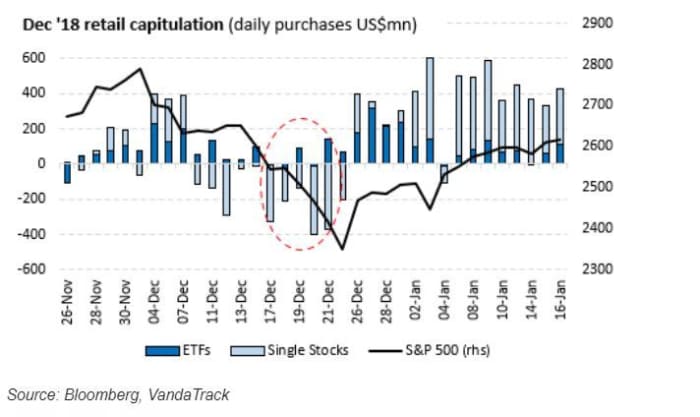
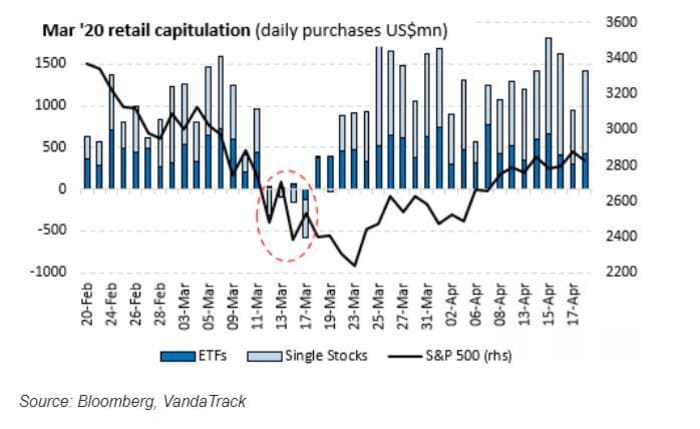
Analysts at Vanda Research led by Marco Iachini said in a weekly research note that while retail interest in U.S. stocks reached its lowest level of the year so far on Tuesday, they still haven’t reached levels of “capitulation” on par with what was witnessed before stocks turned around in December 2018 and March 2020.
What might retail capitulation look like? The Vanda team said that during the last two major selloffs in 2020 and the late 2018, total “capitulation” didn’t arrive until retail traders had become net sellers of stocks.
Source: VandaTrack
Using a pair of charts, the Vanda team showed that retail investors became net sellers of stocks for at least a few sessions just before the S&P 500 index SPX, +0.61% began to rebound in both 2018 and 2020.
Vanda Reseach
Vanda Research
To be sure, retail investors are a much bigger force in markets today than they were four years ago, as average daily trading activity by small-time traders has increased substantially, according to flows data collected by Vanda from several of the most popular discount brokerages used by retail traders, including Charles Schwab SCHW, +0.49%, TD Ameritrade and others.
And retail interest isn’t the only measure of market “capitulation”, a term that represents signs of exhaustion that typically emerge before stocks bottom out. For example, when it comes to popular market-based measures of capitulation, it’s worth noting that the CBOE Volatility Index, the Wall Street “fear gauge” that reflects expectations for market volatility over the coming 30 days based on activity in options markets, has yet to flash its most closely watched exhaustion signal.
As MarketWatch pointed out in a story from May, investors typically associate a reading above “40” on the VIX with capitulation. The gauge topped out above 80 in November 2008 and again in March 2020. But it has yet to cross this threshold so far this year.
Then again, every selloff is different. During the selloff in March 2020, the S&P 500 fell 34% in just 23 trading days. This year’s selloff has been drawn out over a much longer period with the S&P 500 falling more than 20% over a span of almost six months. Still, U.S. stocks appear headed for the worst first-half performance since 1932, according to Deutsche Bank.
Interestingly, when measured in terms of duration, the present bear market is already growing a little long in the tooth.
At more than five months old, the 2022 selloff is already older than six other bear markets going back nearly 40 years, according to LPL Financial Chief Market Strategist Ryan Detrick. In that time, only the bursting of the dot-com bubble, and the selloff that followed the Great Financial Crisis lasted longer.
Whether equities rebound from here will ultimately depend on how expectations for inflation and economic growth evolve over the coming months, as Federal Reserve Chairman Jerome Powell has repeatedly promised that the Fed will be data dependent.