

Lambert here: Larry Summers has risen from the grave (amusingly, all the graphic file names include “summers”). Interesting ideas, though. Who knew that mainstream economists would invent metrics completely divorced from “lived experience”?
By Marijn Bolhuis, Economist at International Monetary Fund, PhD Candidate in Economics at University Of Toronto, Judd Cramer, Lecturer in Economics at Harvard University, Karl Oskar Schulz, Harvard economics concentrator, and Lawrence H. Summers, Charles W. Eliot University Professor and President Emeritus at Harvard University. Originally puhlished at VoxEU.
Economists typically rely on unemployment and inflation rates to gauge how consumers feel about the economy. This column examines why consumer sentiment in the US remained depressed in 2023 despite low unemployment and falling inflation, and finds that increasing borrowing costs can explain much of this gap. The cost of money is not included in traditional price indexes, indicating a disconnect between the measures favoured by economists and the effective costs borne by consumers. The authors develop alternative measures of inflation that include borrowing costs and can account for almost three quarters of the gap in US consumer sentiment in 2023.
Americans were miserable in 2023. The University of Michigan’s consumer sentiment index sat one standard deviation below its historical average in December. This happened while inflation declined significantly over the year, and the unemployment rate remained low, which would traditionally have presaged an uptick in sentiment (Figure 1A). Instead, there was a two standard deviation gap between predicted and actual consumer sentiment. Economists, the authors included, raced to find reasons for this discrepancy. Explanations for this anomaly have ranged broadly from arguments about the lagged effects of inflation to suspicions that partisanship and ‘vibes’ lay behind this startling gap (e.g. Cummings and Mahoney, 2023a).1
Others have highlighted the importance of ‘salient prices’ – especially grocery and gasoline prices, which behaved erratically over the Covid era – to explain consumers’ disappointment with the recent positive economic numbers. 2
Many of these hypotheses and others have been absorbed into the ‘referred pain’ hypothesis, which suggests that non-economic concerns may now drive economic sentiment.
In recent work (Bolhuis et al., 2024), we argue that many of the recent explanations overlook a crucial mechanism that was better appreciated by economists and policymakers in the past: increases in the cost of money. Wright Patman, the long-serving Chairman of the House Committee on Banking and Currency, inveighed against the policy of “fight[ing] inflation by raising interest rates. Throwing gasoline on a fire to put out the flames would be just as logical.”3
Patman was mostly wrong, since the Federal Reserve has historically been effective using interest rate policy to lower inflation, albeit with long and variable lags. However, he did have a better grasp on one aspect of monetary policy than modern economists: consumers consider the cost of money part of the cost of living.
Thus, last year as interest rates jumped to 20-year highs, with the mortgage payments, car payments, and other credit payments required to finance everyday purchases rising substantially, consumers felt the financial squeeze. In the US, home prices are up almost 50% since the start of the pandemic, while the 30-year mortgage rate has tripled since the historic lows of 2021. Consequently, the interest payment on a new 30-year mortgage for the average house has increased more than threefold since 2021, and the payment on a new car loan has increased more than 80% since the start of the pandemic. As a result, the interest payments made by households grew by about 30% in 2023, the fastest growth rate on record (Figure 5A).
None of these increases, however, enter directly into the US Consumer Price Index (CPI). This was not always the case. When Arthur Okun created his ‘misery index’ in the 1970s (e.g. Okun and Perry 1978), adding CPI inflation to the unemployment rate as the measurement of consumers’ economic wellbeing, mortgage rates and car financing rates were included in the CPI. These were removed in 1983 and 1998, respectively, meaning that today’s misery index is missing a key component of consumer spending. Acknowledging this gap is crucial to understanding the current state of the American consumer.
Concerns Over the Cost of Money Are at Historic Highs
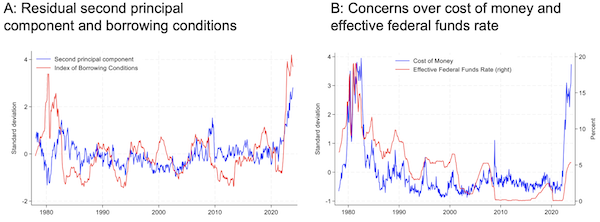
The variation in the current University of Michigan Index of Consumer Sentiment, which cannot be explained by inflation and unemployment, has historically shown a strong correlation with proxies for the growth of consumer borrowing costs, and the willingness of banks to extend consumer installment loans. We grouped together secondary questions in the University of Michigan’s survey into two principal components: concerns about income and concerns about the cost of living (Figure 1B).4
The first principal component, estimated on pre-Covid data only, captures concerns over incomes. It is currently at a low level, comparable to 2019. Concerns over income are thus consistent with the current environment of low unemployment and cannot explain the consumer anomaly.
Figure 1
Notes: Figure 1A: blue line is Index of Consumer Sentiment (ICS, standardized). Red line is predicted consumer sentiment from a linear model using the U-3 unemployment rate and 12-month growth of headline CPI price index as inputs. Figure 4B: blue and red lines are the first and second principal component of answers to secondary consumer sentiment questions that are not directly incorporated in the ICS, estimated for the 1978-2019 period. For the full list of secondary questions, see Appendix Table 1 of Bolhuis et al. (2024).
Source: University of Michigan, FRED, and author’s calculations.
The second principal component captures concerns over the cost of living. It is strongly correlated with headline and core inflation, peaking during the inflationary cycle of the early 1980s, the early 1990s, the late 2010s, and the recent post-Covid period. The residual variation in the second principal component that cannot be explained by variation in official inflation has increased sharply during this cycle, however. This residual variation correlates strongly with both the real growth of interest expenses for mortgages and the percentage of banks reporting increased willingness to make consumer installment loans (Figure 2A). These results indicate that the gap between consumers’ level of concern and official inflation rates may be explained by the exclusion of the cost of money from official measures.5
Figure 2
Notes: Figure 2A: blue line is the variation in the second principal component that cannot be explained by the 12-month growth rate of headline CPI and the first principal component. We construct this measure by retrieving the residual of a linear regression of the second principal component on the two other variables. Red line is the first principal component of (i) the percentage growth of the 30-year fixed mortgage rate and (ii) the rate on 48-month auto loans, both relative to the average of their 1-year, 2-year and 3-year lags, and (iii) the Federal Reserve Board’s diffusion index of in the SLOOS, estimated on monthly data from 1978 to 2019. Figure 6A: The Cost of Money Index is the first principal component of the standardized answers to six questions on the borrowing costs for durables, vehicles, and homes. Appendix II in Bolhuis et al. (2024) contains the figures that plot the answers to these questions over time. Red line is the effective federal funds rate.
Source: University of Michigan, FRED, and author’s calculations.
Additionally, we show that the other questions in the survey that provide direct evidence that the concerns of consumers about borrowing costs are at historic highs, surpassed only by the Volcker era. We construct a Cost of Money Index which summarises the variation in the answers to questions on the borrowing costs for durables, vehicles, and homes (Figure 2B).6
Concerns over the level of interest rates show two clear peaks. The first is during the Volcker era, when the Federal Funds rate and mortgage rates exceeded 15%. Concerns dropped sharply after the Fed eased policy in 1982. We are currently experiencing the second large peak in consumer concerns over the level of interest rates.7
The Fed has paused tightening and long yields seem to have peaked, and so the level of concern has reached a plateau – but it has not yet reversed.
Explaining Consumer Sentiment Using Alternative Inflation Measures
In our paper, we discuss alternative CPI measures that explicitly incorporate the cost of money. We explain the methodology the Bureau of Labor Statistics (BLS) used historically to calculate the CPI measures for housing, which included a measure of the cost of homeownership which reflected mortgage payments. The current methodology relies solely on the rental market to impute the change in the price of owners’ equivalent rent (Bolhuis et al. 2023). We also discuss the market for auto loans and personal interest payments in consumption to propose proxies that better reflect the actual costs borne by consumers.
Having made these points, we then present alternative CPI measures that reflect mortgage interest payments, personal interest payments for car loans and other non-housing consumption, and lease prices for vehicles. Our main alternative inflation measure reconstructs the CPI inflation that formed consumers’ unfavourable impressions of the Carter administration in the late 1970s and expand it using the costs of homeownership and personal interest payments.8
These alternative measures show both a much higher peak and a continued high level of inflation throughout 2023 (Figure 3).
Figure 3 Official and estimated CPI using pre-1983 housing methods and including personal interest payments, 1972-2023
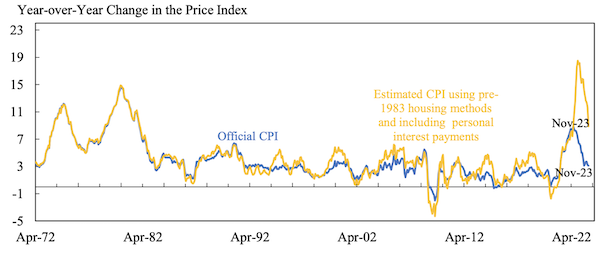
Note: Personal interest payments exclude mortgage payments.
Source: Bureau of Econimic Analysis; authors’ calculations.
Finally, we show that using our alternative methodology for CPI inflation does much to resolve the puzzle of continued depressed consumer sentiment in a situation of low unemployment and falling official inflation. Throughout 2023, the consumer sentiment gap after accounting for unemployment, official headline CPI inflation and growth in the US stock market stood at 2.1 standard deviations of consumer sentiment on average (Figure 4A). There has been some discussion, subsequent to the release of our working paper, that the most important factors for consumer sentiment are grocery prices and gasoline prices rather than a measure which incorporates borrowing costs. We find, however, that the gap is nearly unchanged when we include the change in grocery and gasoline prices as additional control variables Using our preferred alternative inflation measure instead of official inflation, the sentiment gap fell to 0.6 standard deviations on average at the end of 2023. Accounting for the costs of homeownership and personal interest payments thus closes more than 70% of the average gap in economic sentiment in 2023 (Figure 4B). We add those variables to our earlier models and find no evidence that these variables do much to explain the gap in predicted sentiment in 2023 (Figure 5B).9
Figure 4
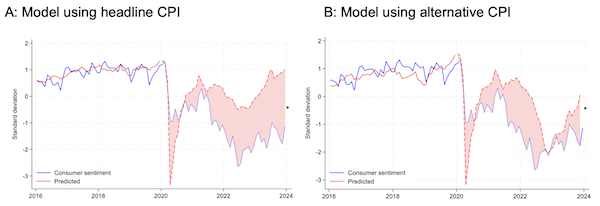
Notes: Figure 4A: Blue line is the standardized index of consumer sentiment (ICS). Solid red line is in-sample predicted ICS using model a linear model of the ICS on 12-month official headline CPI inflation, the unemployment gap, and the 12-month growth rate of the US stock market on data for 1978-2019. The dashed red line is the out-of-sample prediction. Preliminary reading for January 2024 in green. Figure 4B: Same but using alternative CPI inflation instead of official headline CPI inflation.
Source: University of Michigan, FRED, and author’s calculations.
Figure 5
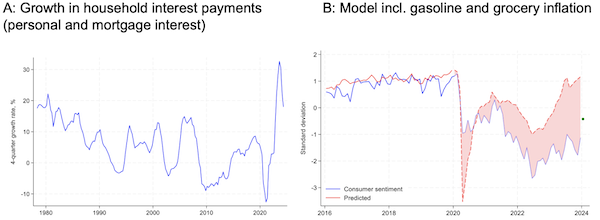
Notes: Figure 5A: Blue line is 4-quarter growth rate of the sum of personal interest payments and household interest payments. Figure 5B: See figures 4A and 4B. Model includes 12-month growth rate of CPI gasoline and food at home.
Source: University of Michigan, FRED, and author’s calculations.
Conclusion and Implications
The gap between economists’ measurements of economic wellbeing and consumer sentiment in 2023 puzzled many. By the middle of last year, commentators were speaking of a ‘vibecession’ – a recession experienced not in rising costs of living or growing unemployment but in ‘vibes’ (Levin 2023). Was consumer sentiment, which should have been high given GDP growth, declining prices, and continued strong employment in 2023, presaging a recession? Would everything turn around if grocery prices and gasoline prices normalised? Our work presents a more tangible explanation for the departure of consumer sentiment from economic ‘fundamentals’: consumers are including the cost of money in their perspective on their economic wellbeing, while economists are not.
We also show that the current gap is not unique to the US or this cycle. Consumers are digesting economic data in a way that is consistent with consumer sentiment during previous bursts of high inflation and increasing interest rates. The inclusion of borrowing costs into an alternative measure of CPI inflation significantly narrows the gap between predicted and actual consumer sentiment by 70%. Cross-country evidence confirms that consumers around the world care about the cost of money. We found little evidence that the US, despite its rising partisanship, social distrust, and large reported levels of overall ‘referred pain’ differs meaningfully from other Western democracies.
After the release of our paper, consumer sentiment has rebounded from its lows. This is consistent with our hypothesis as interest rates have stopped increasing and the market is pricing in interest rate cuts. Our research suggests that these cuts, if and when they come, have large potential for buoying consumer sentiment.
Authors’ note: The views expressed herein are those of the authors and do not reflect the views of the IMF, its Executive Board, or IMF management.
Footnotes
- A full discussion of the political gap in consumer sentiment is beyond the scope of this brief paper, see Cummings and Mahoney (2023a) for a recent discussion and Cummings and Mahoney (2023b) discussing the lagged effects of inflation. The term ‘vibecession’ was invented by Scanlon (2022). Ip (2023) laid out the case for ‘referred pain.’
- “White House economists have run their own calculations on consumer sentiment. They find it is largely dragged down by persistently high grocery prices and residual frustration with the coronavirus pandemic.” Quoted in (Tankersley 2024)
- As quoted in Seelig (1974: 1049). Alchian and Klein (1973) provide early arguments for including asset prices in price indices.
- Principal component analysis (PCA) transforms high-dimensional data with a large set of variables into a small number of new orthogonal variables that explain the greatest variance of the underlying data. In macroeconometric time series analysis, PCA has been used extensively for dimensionality reduction in large now- and forecasting models, most prominently dynamic factor models (e.g. Stock and Watson 2002, 2011).
- As we explain in more detail in section III of the paper, until 1983, official CPI inflation did include the cost of borrowing through the cost of home ownership component (e.g. Bolhuis et al. 2022). Indeed, Figure 5B in the paper shows that in the early 1980s, borrowing conditions were not correlated with residual variation in consumer sentiment.
- The share of households that found it a bad time to buy a car because interest rates are high stood at 34% in November (30% in December), the highest level ever. 68% (64% in December) of respondents found it a bad time to buy a house because interest rates are high, the highest level since 1982.
- What matters both in theory and in the data is the percentage growth in interest rates faced by consumers, not the percentage point change. The growth rate of the spot price consumers pay for borrowing (i.e., the inflation rate of the cost of money) is currently at record highs.
- Formally, we run a linear regression of the 12-month growth of CPI homeownership costs on 12 lags of the growth rate of home prices, 30-year mortgage rates, and the product of these two variables. We then use the estimated model to predict what the inflation rate of homeownership costs would have been for the post-1983 period. CPI data are from Bolhuis et al. (2022) and mortgage rates are from Freddie Mac. We use median home prices from the U.S. Census Bureau for the period before 1988 and the S&P/Case-Shiller U.S. National Home Price Index from 1989 onwards. Given that the latter are reported with a lag, we extrapolate home prices using Zillow’s Home Value Index if the Case-Shiller measure is missing. This is like the approach pursued by Barton and Lee (2022) which extended the work of Hazell et al. (2020). Results appear consistent for overlapping periods. Personal interest payments are added by assuming that expenditures in the CPI increase by the share of personal interest payments in the PCE relative to the sum of personal consumption expenditures and personal interest payments. We use a constant weight of 2.5 percent. This is a conservative assumption, since the PCE uses a broader definition of consumption which also includes items that are not paid out of pocket. In practice, the size of personal interest payments relative to payments for items in the CPI is therefore higher than what we assume.
- These results are available upon request.
References are available at the original.
