Housing affordability in the United States has steadily declined throughout 2022 as prices and interest rates continue to rise. Affordability plays an enormous role in the housing market’s direction, and recent declines are the leading factor in the housing correction we’re currently experiencing. To understand where the market is going, we need to look closely at this issue.
Has affordability ever been as low as it is today? Is this level of affordability sustainable, or could it get worse? What markets are still affordable?
These are all critical questions that can help inform your investing strategy. In this article, I’ll help you make sense of today’s housing market by exploring the history of housing affordability in the U.S., how the U.S. compares to other countries in terms of housing affordability, and help you identify some of the most and least affordable markets in the nation.
Please note that affordability is a huge topic—too big for any one article. In future articles, I will look to address additional aspects of affordability like the causes, potential solutions, and rent affordability.
Housing Affordability in the United States
Housing ‘affordability’ refers to how relatively easy is it for an American with an average income to afford an average-priced home. Right now, affordability is relatively low. According to the data provider, Black Knight, affordability is at its lowest since the early 1980s. This follows an extended period of relatively affordable housing that lasted from the end of the Great Recession until the beginning of 2022.
Housing Affordability (1975-2022) – Black Knight
To understand why affordability has changed course so quickly, we need to examine the primary components of affordability: housing prices, household income, and interest rates.
Housing Prices: When houses get more expensive, it puts downward pressure on affordability. And we all know housing prices have grown tremendously over the last two years, going up 38% nationally from July 2019 to July 2022.
Household Income: The income of a prospective homebuyer is, of course, an important factor. Wages have risen 16% since the beginning of 2020, which is very quick in historical contexts but not nearly enough to keep pace with housing prices (or inflation).
Interest Rates: Most Americans use some sort of debt to finance a home purchase. As interest rates rise, debt becomes more expensive, and the costs of a home purchase go up. For example, buying a $400,000 house at 4% interest would cost the buyer about $1,910/month. At 6% interest, the same house would cost just under $2,400/month.
With this context, it should be easy to see why affordability has trended in the way it has. At the beginning of the pandemic, interest rates plummeted, creating one of the most affordable housing markets we’ve seen in the U.S. for as long as I have data for.
Housing prices started going up rapidly in the second quarter of 2021, but ultra-low interest rates kept things relatively affordable for the following 18 months. Then, in January 2022, mortgage interest rates started rising from an average of 3.1% for a 30-year fixed rate mortgage up to 6% by early September 2022.
Needless to say, affordability has tanked. Wages have gone up during this period, but not nearly enough to offset the rapid growth of home prices and interest rates since the beginning of 2022.
We’ve found ourselves in a period of low affordability, but it’s important to note that this level of affordability is not unprecedented. If you revisit the chart earlier, you’ll see that housing was less affordable in the 1970s and 1980s due to super high interest rates. If you’re curious, housing prices did continue to rise on a nominal (not inflation-adjusted) basis through the period of low affordability back then, but there were some periods of high inflation during that time. The last time housing was as close to this level of affordability was preceding the Great Recession, and we all know what happened then.
So, if you’re wondering if this level of affordability is sustainable, the short answer is yes. In the early 1980s, housing was considerably less affordable than today and remained that way for about five years. Of course, historical data doesn’t tell us what will happen next, but it does show us that it’s feasible for housing to remain at low affordability for a long time.
Housing Affordability Across the Globe
Another way we can try to understand whether current affordability levels are sustainable is by looking at international comparisons. To do this, I examined data from the 2022 Demographia International Housing Affordability study.
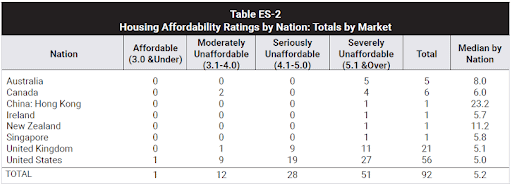
This report looks at housing affordability across 92 metropolitan areas in Australia, China, Canada, Ireland, New Zealand, Singapore, the U.S., and the U.K. The study ranks each market as either affordable, moderately unaffordable, seriously unaffordable, or severely unaffordable, as measured by a metric known as the “median multiplier.”
The data shows that the U.S. actually has the lowest median average by nation. Note that many of these countries have only one market, and therefore the median is not a good representation of the country as a whole. Also, note that this data is from 2021—before interest rates rose in the U.S.—but still tells an important story.
 Housing Affordability Rating by Nation – Demographia International Housing Affordability
Out of all markets, Pittsburgh, Pennsylvania, is the most affordable. Hong Kong was the least. If you look at the data closely, you can see the wide variance in U.S. markets. Pittsburgh’s median multiplier is just 2.7, while San Jose’s is 12.6, a massive difference!
Even though nearly half of the markets in the U.S. measured fell into the “Severely Unaffordable” category, the U.S. also had the only market in the “Affordable” category and had a wider distribution of markets. In short, housing is pretty unaffordable in all of these markets, but relatively speaking, the U.S. has more affordable options than other countries. You can see the full list of markets below.
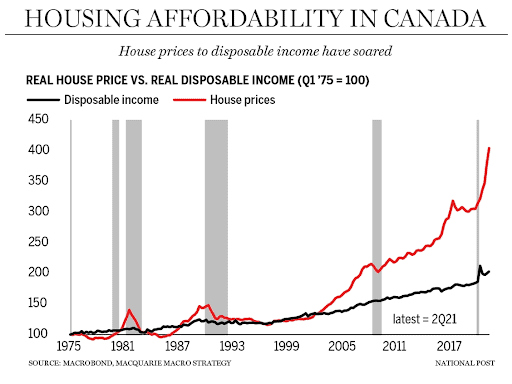
To return to the question of the unaffordability of housing in the US, Canada is a good means of comparison. Canada’s housing market has been on fire for decades and took a much smaller hit than the U.S. did in the late 2000s.
 Housing Affordability in Canada (1975-2022)
Canadian housing prices have accelerated to all-time low affordability levels (as measured by a different methodology than the data above) without falling. Of course, this could (and probably will) change soon, but you can see that housing got less affordable for over 20 years. Despite some periodic declines in pricing, the trend here is clear. Housing has been getting progressively less affordable in Canada for decades and is unlikely to return to the affordable levels seen around 2000 anytime soon.
Could the U.S. be on this path as well?
What This All Means
In the broadest sense, the U.S. is not in unprecedented territory, even given recent declines in affordability. Housing is at the lowest level of affordability in decades, but it’s been lower in the past, and it’s right in the middle of the pack compared to other countries.
That said, I think something has to change for affordability to improve. Historical precedence and international comparisons are important, but people generally have a strong recency bias. Since the Great Recession, as a country, we’ve become accustomed to housing being more affordable than it is today. Most homebuyers don’t remember the 1970s or 1980s. Instead, they remember the last decade when housing was relatively more affordable. As such, I believe demand will remain relatively low until affordability changes course and heads to a more normal level. The loss in demand will continue to put downward pressure on pricing in the housing market. Additionally, the Fed is likely to reverse course on interest rate hikes at some point, which would improve affordability, but that might not happen until 2024.
Of course, every market is going to behave differently. As we saw above, affordability in Pittsburgh is high, and therefore demand will probably not drop as much as it will in San Jose (which saw the largest month-over-month price declines from June to July 2022.) So it’s very important to understand how affordable housing is in the markets where you invest. The National Association of Realtors (NAR) provides some really great data for this.
My personal hypothesis is that affordability will play a major role in regional housing markets for years to come. Some markets are just too unaffordable, and demand will drop to the point where prices fall. Some markets will see modest declines, and others will be more dramatic.
On the other hand, affordable markets could see an uptick in demand. Work from home is here to stay for many companies, and I believe that more affordable cities will likely continue to see large levels of domestic migration, which will increase demand and put upward pressure on housing prices in those regions. These types of markets could continue to grow in the coming years, even as many major markets experience a correction.
What’s your hypothesis? Do you think housing affordability will worsen, and what role will it play in your local market? Let me know in the comments below.
On The Market is presented by Fundrise

Fundrise is revolutionizing how you invest in real estate.
With direct-access to high-quality real estate investments, Fundrise allows you to build, manage, and grow a portfolio at the touch of a button. Combining innovation with expertise, Fundrise maximizes your long-term return potential and has quickly become America’s largest direct-to-investor real estate investing platform.
Learn more about Fundrise
Note By BiggerPockets: These are opinions written by the author and do not necessarily represent the opinions of BiggerPockets.

