

Benjamin Adric Dunn, a data scientist at the Norwegian University of Science and Technology, shows me a picture of unevenly spaced dots arranged vaguely like the rocks at Stonehenge. The overall pattern is clear—at least, to a human. “When we look at this, it’s obviously a circle,” he says. But an algorithm would likely struggle to recognize this simple shape. “It very often misses the big picture.”
Many scientific processes involve loops, or repetitions. A computer’s inability to see these relationships is a problem for scientists who want to identify circular patterns within huge masses of data points. Data are often visualized as dots floating in space, like stars in the night sky. A dot might represent a physical location, like the two numbers for longitude and latitude marking where a ship is on the high seas. Genes can likewise be plotted in a mathematical space of many dimensions—hundreds sometimes—so that two genes with similar DNA sequences will be represented by nearby points. The significance of a circular pattern within the data depends on context. Circles in a ship’s position might indicate that it is lost, whereas circles within genetic data may demonstrate an evolutionary relationship.
Often these starry skies of data points are too complex and high-dimensional to study with the naked eye. To detect circles, researchers require a set of instructions precise enough for a computer to understand. But many standard techniques for data analysis are based on a type of mathematics known as linear algebra, which studies straight lines and flat planes. To hunt out loops, researchers are instead turning to topological data analysis (TDA), which offers a radically different perspective.
In contrast to the relatively simple and rigid structures that characterize linear algebra, TDA is grounded in topology, a branch of mathematics that studies pliable, stretchy shapes. Because its practitioners assume that all shapes are arbitrarily flexible, topology is often called rubber sheet geometry.
Like the formation of constellations from stars, topological data analysis helps mathematicians build revealing shapes from scattered dots. Researchers begin by using the data points as nodes or joints in a virtual scaffolding, building complex structures that may extend through hundreds of dimensions. The resulting picture contains much of the essence of the original data but in a more tangible form. They study these structures using a topological perspective—looking for features that are preserved even if the scaffolding is stretched or bent.
Topology’s usefulness in data analysis lies in its ability to reveal qualitative, rather than quantitative, properties. It identifies the aspects of the structure that persist even if there are random errors, or noise, in the underlying measurements. Noise often jiggles the underlying data, but the topology remains the same—revealing robust features of the system. “There are lots of instances in the real world where the data given to you are squishy,” says Robert Ghrist, a mathematician at the University of Pennsylvania. “So you’ve got to use squishy math.”
Mathematicians and scientists are now working together to find unusual topological shapes in a vast range of data, representing anything from biological processes with daily rhythms to the structure of drug molecules. Perhaps the most intriguing of these investigations pertain to brain structure. Mathematicians have used topology to explore how neurons interact across extended areas of the brain, reacting to different surroundings and stimuli. In collaboration with neuroscientists, Dunn recently found that certain brain cells use a torus, the mathematical name for the surface of a doughnut, to map their environment.
Credit: Jen Christiansen
Doughnuts and Coffee Cups
Even though topologists contort rubber sheets for a living, they are very careful to preserve the number of holes in them. They never punch a new hole or press closed an existing one. There’s a classic math joke that a topologist can’t tell the difference between a doughnut and a coffee cup: they both have one hole.
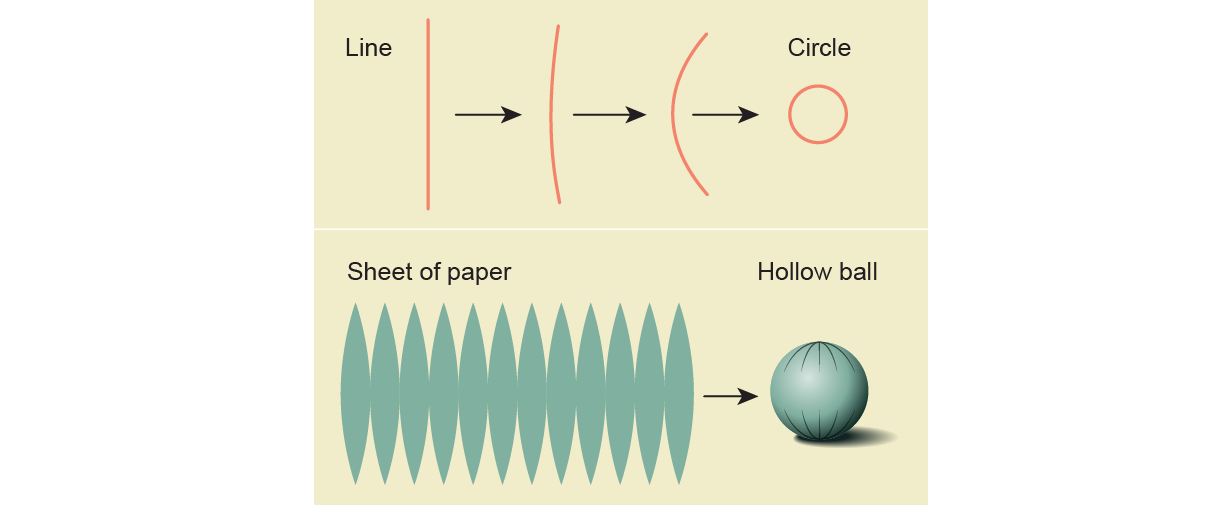
Topologists classify holes based on their dimension. A closed loop, like the numeral 0, has a one-dimensional hole because it is formed by gluing together the ends of a one-dimensional line. Starting with a two-dimensional plane, like a sheet of paper, and taping up the edges will yield something like a hollow ball, which has a two-dimensional hole.
Credit: Jen Christiansen
Higher-dimensional shapes can have higher-dimensional holes. By analogy with the one- and two-dimensional holes, for example, a three-dimensional hole is formed by “closing up” a three-dimensional space, like a cube. But this process can be seen only from a four-dimensional perspective, outside of most people’s—likely anyone’s—reach.
Some shapes have multiple holes of different dimensions, such as an inflatable ball with an attached handle that a child sits and bounces on. The hollow center of the ball is a two-dimensional hole, whereas the solid handle forms a one-dimensional hole. Topology has many precise methods to count holes in higher-dimensional shapes—an ability that turns out to be helpful in studying the brain’s neuronal activity.
Neuroscientist Olaf Sporns of Indiana University thinks of the brain as a massive transportation network. The roads and infrastructure are built from the neurons and their connecting synapses. The brain’s electrical and chemical signals drive along these streets. “The physical roads constrain the traffic patterns that you can observe dynamically on top,” Sporns says. The traffic patterns change as we move and think.
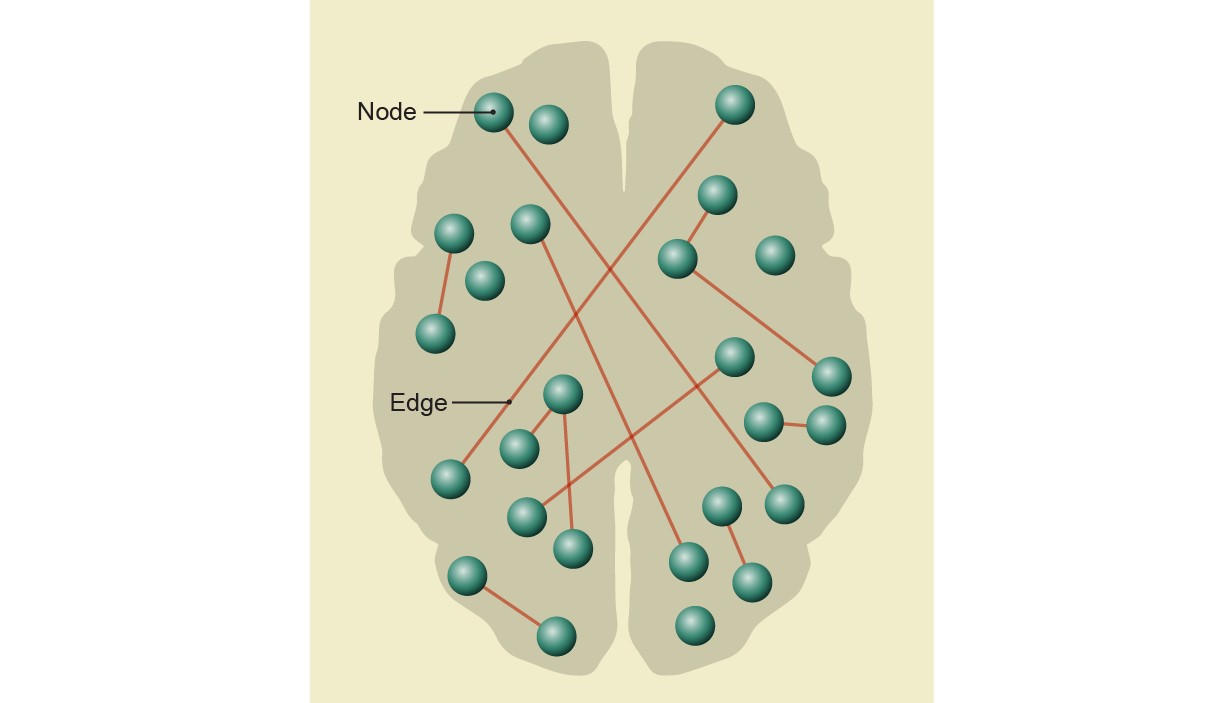
As we squint at a diagram of the brain, it might look like a collection of points, representing neurons. Some of them are connected by lines, indicating a synapse between those particular neurons. Mathematicians refer to this structure as a graph: a collection of nodes connected by edges. The graph flattens the biological complexity of the brain, but it retains the overall shape of the circuits. Such a trade-off is typical when creating a mathematical model, which weighs simplicity and analyzability against usefulness.
Credit: Jen Christiansen
The graph of neuronal connections is a weblike mess: neurons are abundant and richly interwoven. In 2017 Kathryn Hess, a mathematician at the Swiss Federal Institute of Technology in Lausanne, tackled this complication by doing something that is initially surprising: she made the graph more complicated. She analyzed data from the Blue Brain Project, a massive computer simulation of the activity of a rodent neocortex, a part of the brain involved in higher-order functioning. The computer model contains representations of the individual neurons, which are connected to other simulated neurons via synapses. These links, as well as when they are likely to fire, are determined by basic biological principles and by experimental data from laboratory rodents.
The simulation can show the traffic patterns of the brain—the neurons firing in response to a stimulus. Unlike the aerial view of the real brain, however, the simulation can be paused, giving scientists a freeze frame showing which synapses are firing in response to a given stimulus. It is easy to convert this static image into a graph because it indicates the data points, as well as the lines between them: two neurons are connected if a synapse linking them is firing. From this picture, Hess constructed something that mathematicians refer to as a simplicial complex, transforming the simple graph into a voluminous shape.
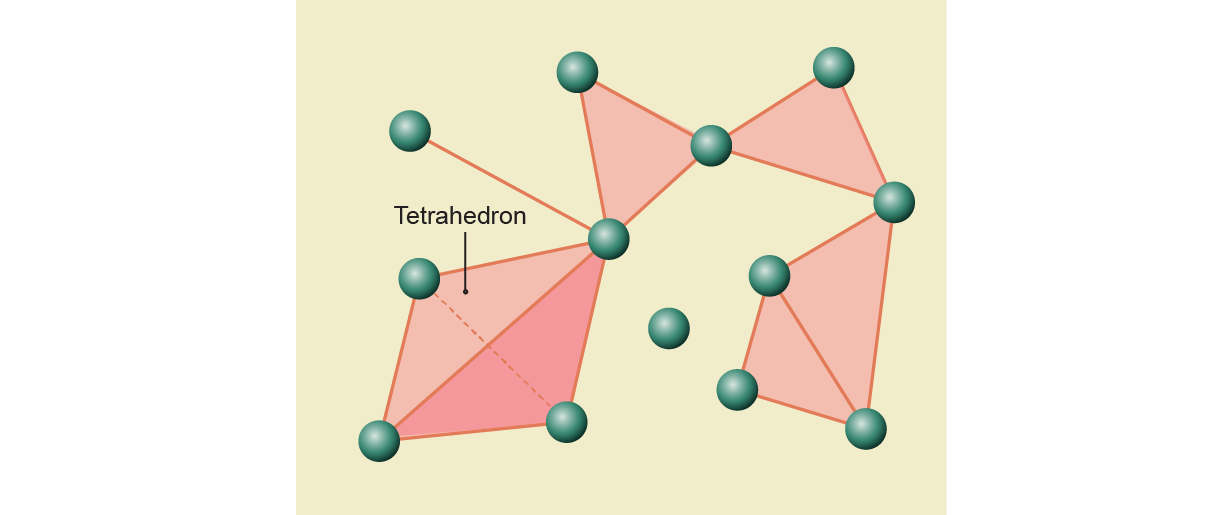
A simplicial complex is built from triangles of different dimensions. In the Blue Brain graph, for example, three neurons with all three synapses between them transmitting signals formed the vertices of a hollow triangle. To expand this structure into a simplicial complex, the mathematicians colored in this hollow triangle with a solid, two-dimensional triangle. Similarly, they filled in larger clusters of connected neurons with higher-dimensional analogs of triangles. For example, a tetrahedron, a solid three-dimensional pyramid with four triangular faces, would fill in a group of four neurons firing together.
The maximum number of neurons that Hess and others observed firing as a group was eight, so the largest piece of this simplicial complex was a seven-dimensional triangle. Many elements overlapped, forming a multidimensional sculpture: a triangle might jut out of a tetrahedron and meet another triangle at a point. Moreover, the mathematicians and scientists examined not just one but a series of freeze frames, taken after simulating a gentle stroke of the rodent’s whiskers. They converted each of these maps into a simplicial complex and analyzed how its shape changed in time using the tools of topology.
Credit: Jen Christiansen
Immediately after receiving the stimulus, the simplicial complexes grew like a massive Lego construction, adding in pieces of higher and higher dimensions until the sculpture reached the maximum of three or four dimensions, depending on the stimulus. Then the whole thing rapidly disappeared. “You have these increasingly complex structures that are being created by the stimulus until it just all collapses,” Hess says.
To a topologist, three lines connected to make a triangle are the same as a hollow circle because one shape can be bent into the other. Because the simplicial complexes that Hess and her co-workers built from the simulated rodent brains are seven-dimensional, they can have holes in up to seven dimensions. Their analysis showed that as the shape grew, the number of holes increased. At its peak, the structure contained a surprisingly large number of two- and three-dimensional holes—many more than a random simplicial complex or one built from a different biological process would yield. The specific pattern of holes revealed a high level of organization in the neuronal response; this complexity may indicate a fundamental feature of thought processes.
Stubborn Holes
More often, however, data are represented by isolated points floating in an abstract mathematical space, with no obvious, preordained connections. To apply TDA, mathematicians need to figure out how to connect them. But there are many possible ways to link stars into a constellation. To find these implicit pictures, mathematicians use a technique known as persistent homology. Topologists analyze a succession of simplicial complexes built at various scales to find the essential features of the data cloud.
To make the first simplicial complex, they cast the widest net possible, connecting every point to every other point to form a dense mesh. Filling in this web with solid forms yields a high-dimensional simplicial complex with few discernible features. But the mathematicians need to compare this complex with others formed by connecting the data at smaller scales. So, next, they cast a narrower net over the same data, connecting only nearby points. Now they have a sparser web, which they use to construct a second simplicial complex. Because this mesh contains fewer data points, its simplicial complex contains shapes of lower dimensions. The researchers repeat the process with a series of smaller nets. “At every scale you’re going to have a different snapshot of what that complex looks like,” says Ranthony Edmonds, a mathematician at the Ohio State University.
Each simplicial complex is a possible constellation formed with the same scattered data dots. Topologists study this spectrum of shapes—recording, in particular, the number of holes in each dimension. They are especially interested in holes that persist through many different scales. Some holes briefly appear and then disappear, but the stubborn holes—those that survive through a range of scales—point to the most essential features of the data. TDA can thus reduce a complex mess of data to a simple list of stubborn holes, in much the way that a JPEG photo file compresses an image. “It’s a way of paring down the data to the stuff that really matters so that we have something much more workable,” Ghrist says.
Sometimes the holes identified in this way have direct interpretations. Mathematician Jose Perea of Northeastern University and a team of computational biologists used persistent homology to find periodic biological processes—those that repeat at regular intervals. Examples include the metabolic cycle of yeast or a mouse’s circadian clock. “What is recurrence or repetition?” Perea asks. “Geometrically it should be like you’re traversing some sort of loop in the space of the thing that you’re looking at.”
TDA has also helped researchers design new drugs. These compounds are often found by tweaking the molecular structure of existing drugs. But the structure of molecules is extremely complex and difficult to analyze, even for machine-learning algorithms. To design novel drugs, computers need to work with simplified representations of the existing molecules. There are many ways to do this, but a team led by Guowei Wei of Michigan State University chose to reduce molecules to their “topological signatures.” This is the description of the chemical based on its topological characteristics—essentially the collection of information gained through persistent homology, such as the number of stubborn holes in each dimension.
Brain loops
The most intriguing application of TDA might be at the most basic level of brain organization—a single type of neuron. In 2014 John O’Keefe and research partners May-Britt Moser and Edvard Moser received the Nobel Prize in medicine for discovering, respectively, place cells and grid cells, types of neurons that activate when an animal is in specific locations. They act as sensors for position, says Carina Curto, a mathematician at Pennsylvania State University.
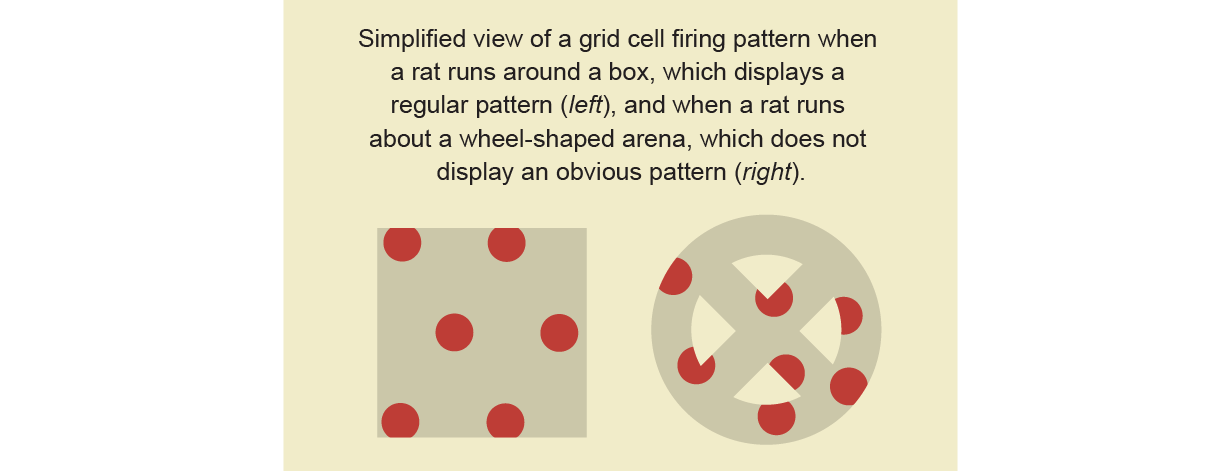
Each grid cell in a rat’s brain lights up when it is in several places within its environment. To figure out the relationship between the grid cells and the rat’s location, neuroscientists picked a single grid cell to study. They drew a dot on a computer model of the floor, marking where the rat was each time that cell activated. As the rat moved freely about the square box, a regular and repeating pattern of dots emerged, of a kind that mathematicians describe as a hexagonal lattice. The dots on the lattice represented all the locations where that particular grid cell lit up. They repeated this process with multiple grid cells, marking each one in a different color. The dots corresponding to each grid cell had the same overall geometric pattern but were offset from one another, covering the box like busy tiling.
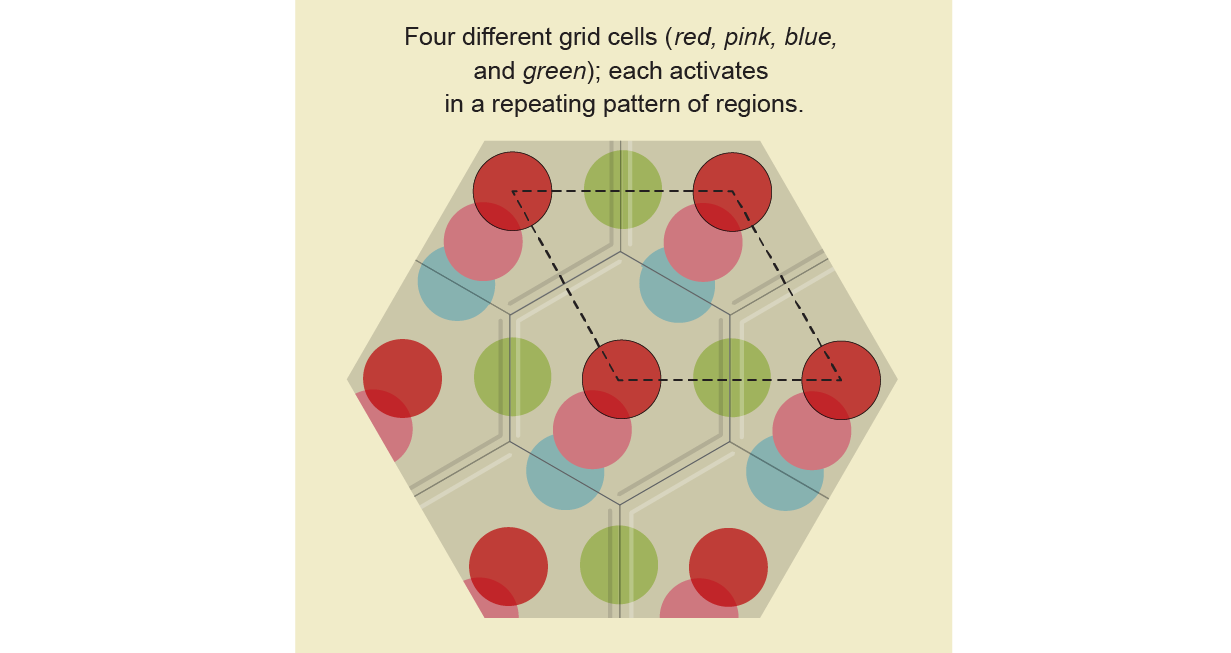
Credit: Jen Christiansen; Source: “What Can Topology Tell Us about the Neural Code?” by Carina Curto, in Bulletin of the American Mathematical Society, Vol. 54, No. 1; January 2017 (reference)
Neuroscientists wanted to understand exactly how the grid cells represented spatial locations—in essence, they were looking for the template that produced the hexagonal pattern. For example, imagine a circular rubber stamp with various cartoon characters printed on it. As you roll out the stamp, it will create a line. The image of Mickey Mouse will appear at regular intervals along the line. But all those images came from the same location on the original rubber stamp. It’s easy to imagine rolling out a stamp, but the reverse question is more challenging: How do you produce the template stamp from the pattern that it created?
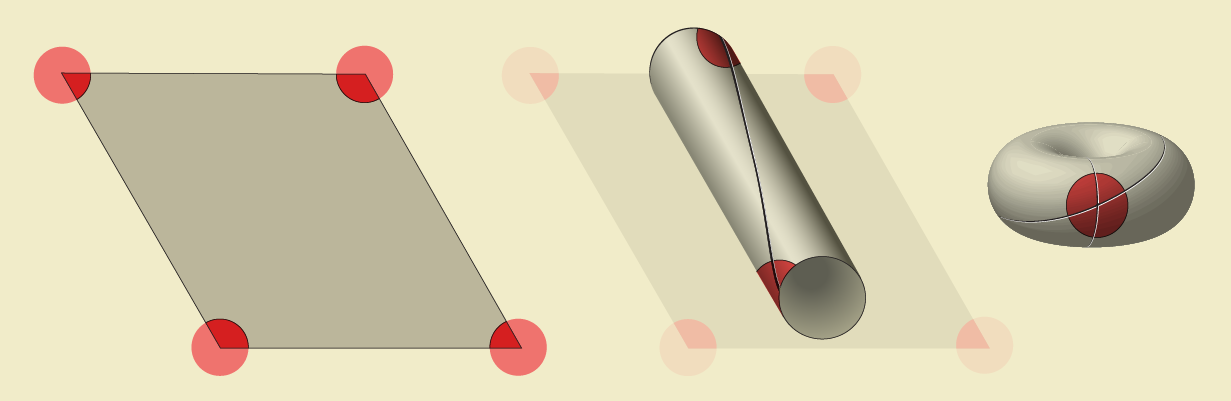
In the tiling of colored dots representing where the rat was when each grid cell fired, four neighboring red dots formed the corners of a slanted rectangle known as a parallelogram. Just like the repeated images of Mickey Mouse, all the red dots of the same color corresponded to a single grid cell. So topologists identified all the red dots, folding the parallelogram into a doughnut shape using an operation they refer to as “gluing.” First, they glued together two opposing sides of the parallelogram, forming a cylinder with two red dots: one on the top and one on the bottom. Next, they bent the cylinder, gluing together the two ends to form a torus. In this way, the four red corners of the parallelogram become a single point on the doughnut. Exactly one dot of every other color will show up on the torus. Thus, just like the circular stamp was the template for the line of cartoons, a torus is the correct map for how grid cells represent the floor of the box.
Credit: Jen Christiansen
Neuroscientists could see this pattern when the rat was running around a box. But it was harder to visualize the pattern when the rat moved around other test fields, like a bicycle wheel with spokes and a central hub. Each grid cell was still firing in multiple positions, but scientists were not confident about the underlying map. The arrangement of dots was not obviously structured.
Credit: Jen Christiansen
In a February 2022 Nature paper, a team of mathematicians and neuroscientists, including Dunn, used grid cells to test a theory called continuous attractor networks, which predicts that certain neurons are wired together in a specific pattern—and the pattern does not change even if the animal is in a different situation. To test the theory of continuous attractor networks, researchers needed to determine whether the grid cells always form a torus, no matter what environment the rat finds itself in. They were searching for tori in messy neurological data—the perfect job for TDA.
This time, instead of marking the positions in a box where a single grid cell fired, the researchers studied the collective activity of an entire network of grid cells. At regular intervals they recorded the state of the network using a string of 0s and 1s, which indicated whether each grid cell was active or not. From a mathematician’s perspective, this long string is a point in a very high-dimensional space. In effect, as the researchers recorded the state of the system at different instants, they were accumulating high-dimensional data points. These points describe the way patterns of grid cell activation evolve in time, but the data are too complicated to study with the naked eye.
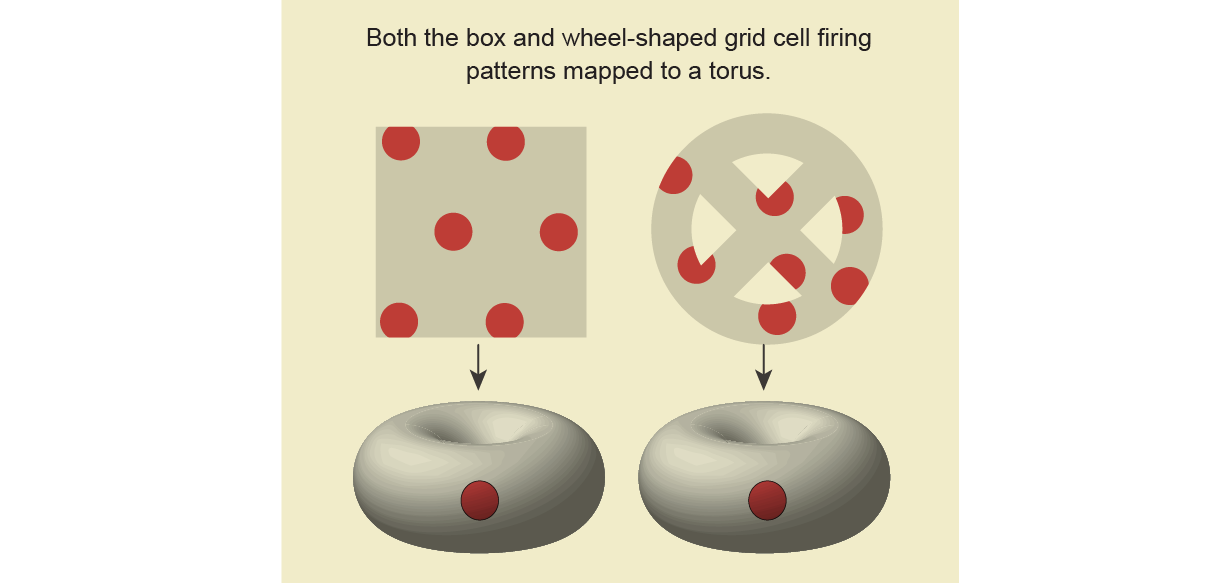
After using some standard techniques to simplify the data, the team computed the persistent homology of the system by connecting the data points at different scales and examining the resulting simplicial complexes. As before, the data formed a torus when the rat was running about a box. But the real test was when the researchers derived data from a rat running around a wheel-shaped arena. To their delight, it again formed a torus.
Credit: Jen Christiansen
The researchers were even able to collect data from a sleeping—possibly dreaming—rat. Again, they found a torus, a shape that persisted regardless of the rat’s environment or state of being, a finding that supports the theory of continuous attractor networks. The doughnut shape seems to be intrinsic to how grid cells represent space.
Many of these applications of topological data analysis are only possible because of powerful new computational tools. “None of this would have happened if people hadn’t seriously started building algorithms,” says Vidit Nanda, a mathematician at the University of Oxford. “If it’s not effective, if it doesn’t scale well, then nobody wants to use it, no matter how beautiful the theory is.”
Thanks to these technologies, the uses of topology, which until recently seemed to be no more than an abstract, if amusing, branch of mathematics, are burgeoning. “The applications are getting stronger and stronger,” says Gunnar Carlsson, a mathematician at Stanford University and one of the pioneers of TDA. “We’ve really crossed the chasm.”