

Yves here. The highly kinetic conduct of the Trump Administration, despite dominating news coverage, is unlikely to divert the attention of most Americans to day to day household budget realities. Inflation has still not been tamed. Consumers face the visible sign of ever-levitating egg prices along with pressure in many other expenditure categories, even with energy prices not presently being a big contributor. Tariffs are set to make matters worse. On top of that, we have Musk Federal employment and program whackage directly damaging many, plus creating broader anxieties.
Below, Tom Ferguson and Sevaas Storm describe a big and not sufficiently acknowledged driver: strong spending at the very top of the income distribution. The well off party on as most of the rest feel the wallet squeeze.
By Thomas Ferguson, Research Director, Professor Emeritus, University of Massachusetts, Boston, and Servaas StormSenior Lecturer of Economics, Delft University of Technology. Originally published at the Institute for New Economic Thinking website
Here we are again.
First the IMF, then the Fed belatedly tiptoed to the conclusion that we reached almost two years ago: that the bubbling consumer demand that has sustained US inflation in the face of Fed interest rate hikes is driven principally by the spending of affluent Americans whose wealth has soared thanks to the Fed’s doubling down on quantitative easing during the pandemic. Due to surging house prices and stock market prices, the net worth of the wealthiest 10% of US households has increased by more than 50% in nominal terms, or $36.3 trillion, during the first quarter of 2020 and the third quarter of 2024. This, in turn, has unleashed a powerful wealth effect on consumer spending, as we have repeatedly pointed out (Ferguson and Storm 2023; Ferguson and Storm 2024a; Ferguson and Storm 2024b).
Now comes Moody’s Analytics with more of the same. A Wall Street Journal article interviews that institution’s chief economist, Mark Zandi, and cites data and charts from the institution in support of the claim that “Many Americans are pinching pennies, exhausted by high prices and stubborn inflation.”
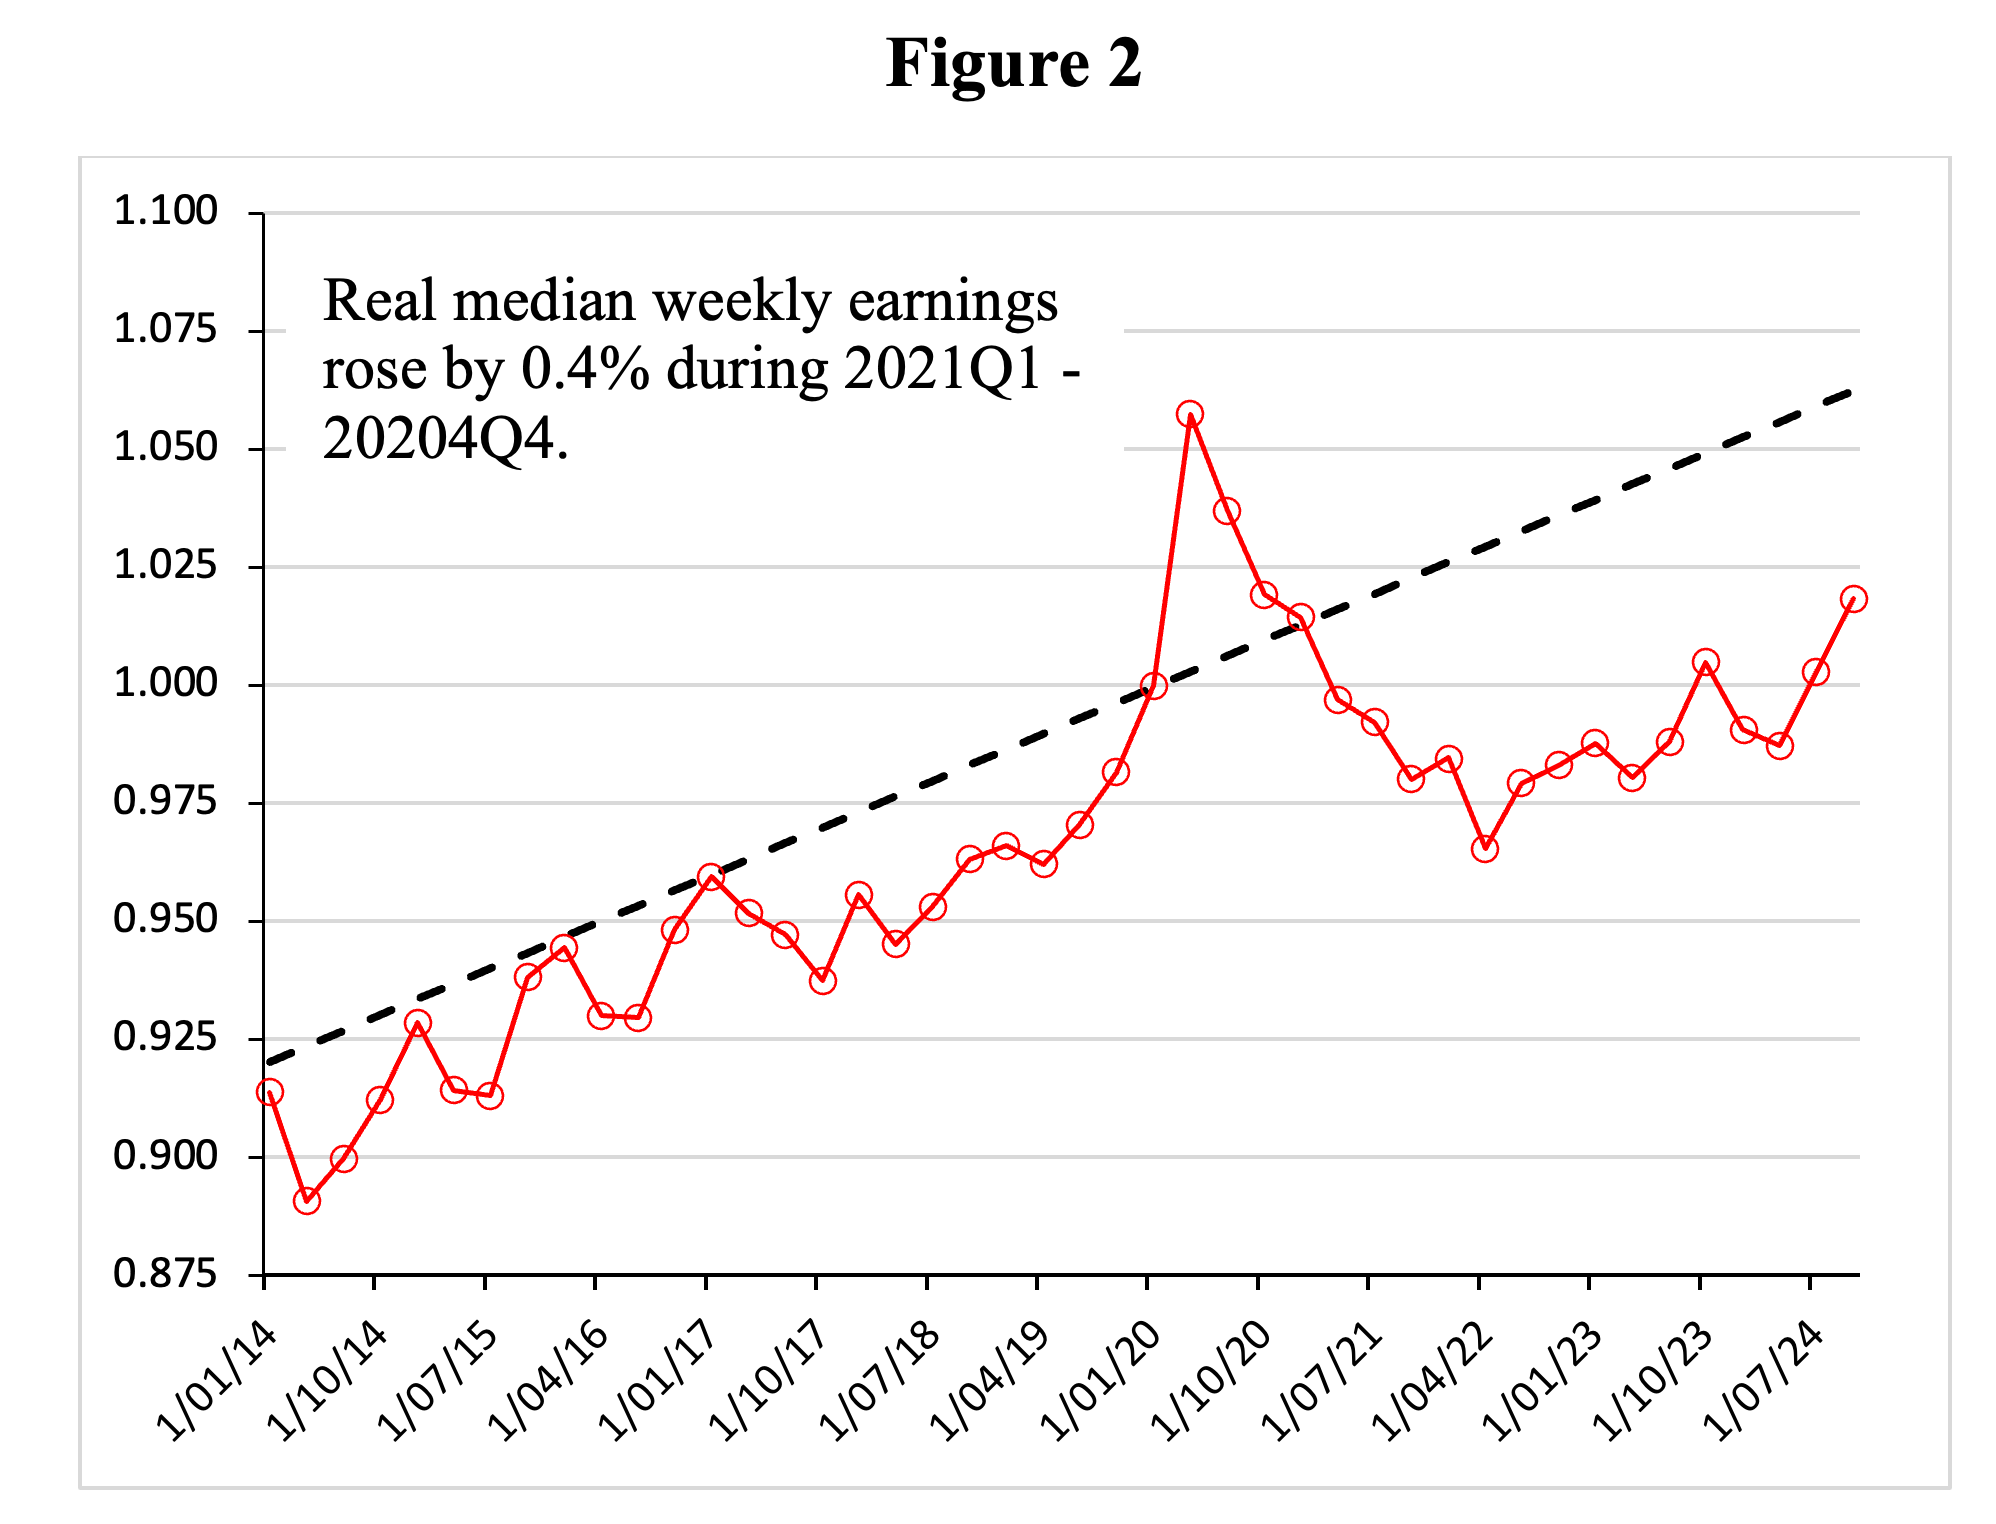
This is underscored by Figure 1, which plots the monthly change in real hourly earnings of American production and non-supervisory employees during January 2021 to January 2025. Higher prices did eat up almost all of the nominal pay raises of American workers, whose real hourly earnings rose by a pitiful 22 dollar-cents during these four years. Similarly, real median weekly earnings of American workers hardly increased during 2021Q4-2024Q4 (see Figure 2), even as prominent economic commentators trumpeted claims that the US labor market was extremely tight. The clamor about the looming threat of an imaginary wage-price spiral (Ferguson and Storm 2024a) diverted attention from the real action: astonishing increases in home values, the stock market, and the net wealth of the top 10%. Between January 2021 and December 2024, the S&P CoreLogic Case-Shiller U.S. National Home Price Index rose by almost 17% (in real terms), while the S&P Stock Market Index increased by a whopping 31% (also adjusted for inflation). In contrast, real weekly earnings of American workers grew by a grand total of just 0.4% during this period.
In America’s ever deepening dual economy, most citizens struggle to afford more than the basics and feel exhausted by the persisting financial stress. But, as the WSJ writes, “the well-off are spending with abandon. The top 10% of earners—households making about $250,000 a year or more—are splurging on everything from vacations to designer handbags, buoyed by big gains in stocks, real estate, and other assets. Those consumers now account for 49.7% of all spending, a record in data going back to 1989, according to an analysis by Moody’s Analytics. Three decades ago, they accounted for about 36%.”
A separate Moody’s Analytics report that Zandi himself issued at virtually the same moment echoes the importance of the wealth effect in explaining the strength of consumer demand and economic growth but cites statistics on spending by the top 20% of the income quintile instead. We have minor reservations about details of both sets of estimates. But none of our reservations add up to anything material. The latest data in the longer Moody’s piece extend to the same period as our last investigation. While neither Moody’s nor the Wall Street Journal ever directly make the crucial final conclusion, the linkage is clear: Yes, consumer demand by America’s most affluent citizens is indeed driving consumer spending, and consumer spending, in turn, is the main force keeping inflation so high.
The CPI inflation jumped in January 2025 — rising by 3% during the 12 months that ended in January and drifting away from the Federal Reserve’s inflation target of 2%. The Fed finds itself in a fix. On the one hand, it cannot lower the interest rate (as President Trump would like it to do), because the wealth bonanza enjoyed by the richest 10% is still fueling spending and inflation, while the majority of Americans have a hard time scraping by. It is perhaps oddly appropriate that a regime so intertwined with unelected billionaires is kept afloat by the spending of the super-affluent.
On the other hand, monetary tightening or any other shock that leads to a stock market selloff or decline in home values would rattle the confidence of the top 10%, cause them to cut back spending and hurt the economy. This may bring down inflation, but the collateral damage would be substantial.
The implication is that the Trump administration has a tiger by the tail. Waiving some qualifications, since after all, unilateral tariffs by the US would be one offs, unless they lead to escalating tariff wars, it is easy to understand why fears of still higher inflation are so pervasive. The Moody’s data provide further confirmation that wealth-price inflation, not any phantom wage-price spiral, is a powerful force running in the background as the administration sorts out its policies on tariffs and other issues.
