Yves here. Tom Ferguson, with Jie Chen, Paul Jorgensen, and now Matthias Lalisse, has built and maintained massive election databases for decades and perform in-depth analyses on the results. For instance, Ferguson, Chen, and Jorgensen analyzed why Ted Kennedy’s seat went to Republican Scott Brown, depriving Obama of a filibuster-proof Senate majority. The team determined via a granular analysis that the proportion of Republican votes correlated strongly with the number of foreclosures in that district.
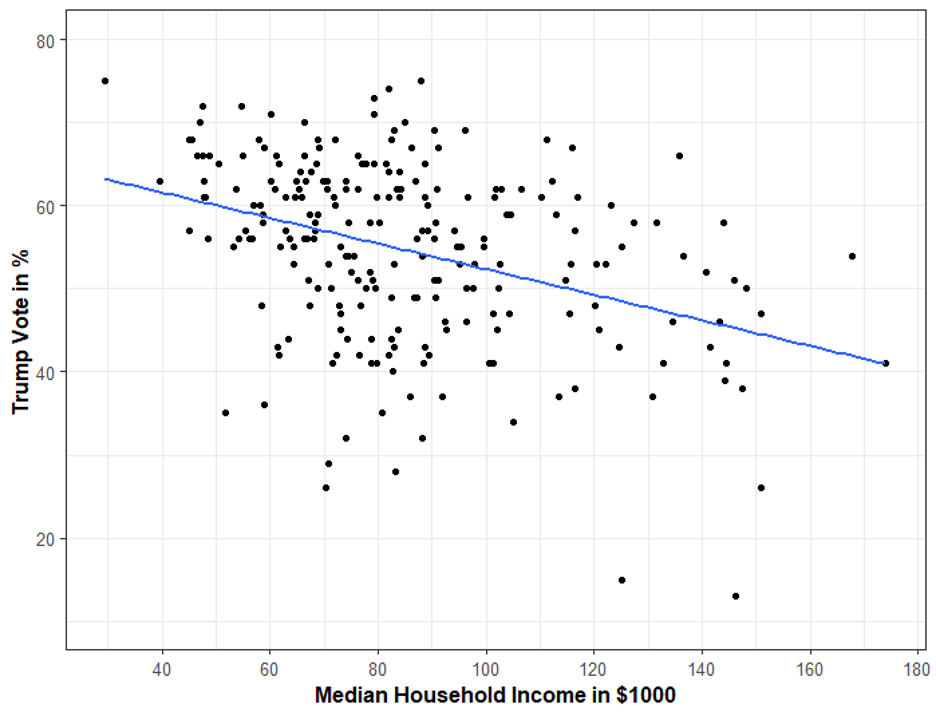
The data-crunchers come up with a similar conclusion for the Trump win in New Hampshire. The vote for Trump correlated negatively with local household incomes. But that is not the entire story….
By Thomas Ferguson, Research Director, Institute for New Economic Thinking and Professor Emeritus, University of Massachusetts, Boston; Jie Chen, University Statistician, University of Massachusetts; Paul Jorgensen, Associate Professor and Director of Environmental Studies, University of Texas Rio Grande Valley; and Matthias Lalisse, Department of Linguistics and Cognitive Science, Johns Hopkins University. Originally published at the Institute for New Economic Thinking website
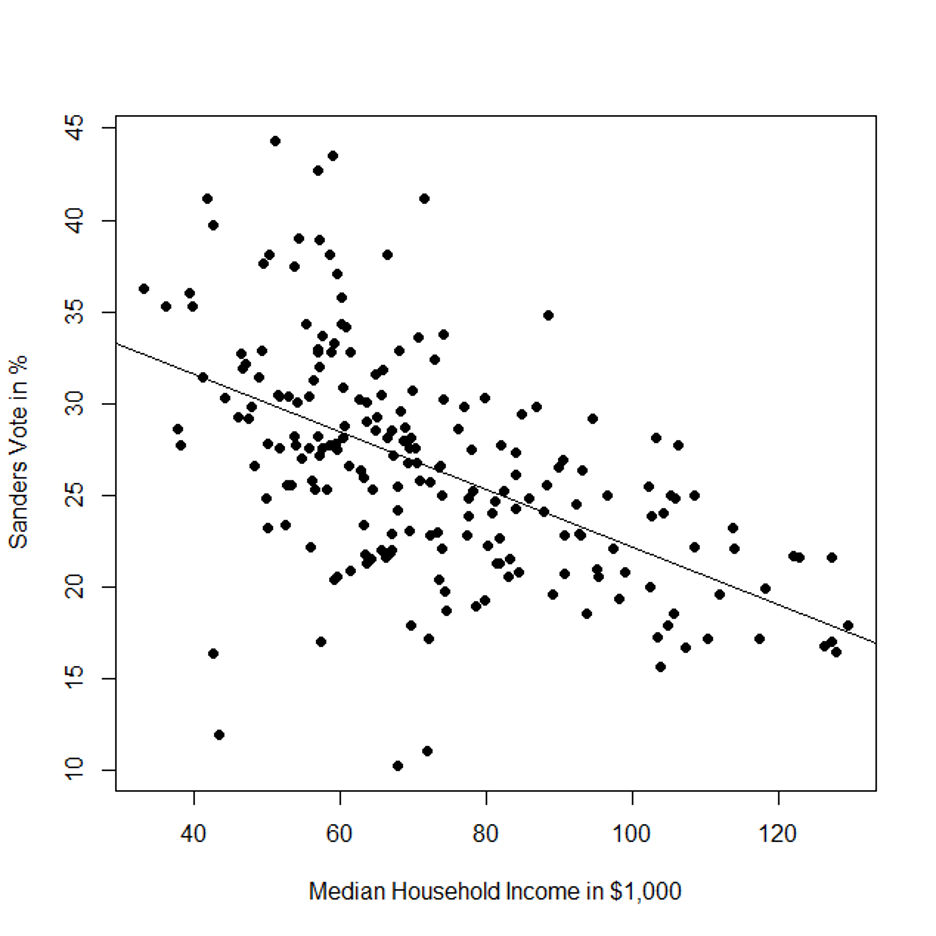
Four years ago, the key takeaway from the New Hampshire primary was obvious. On the Democratic side, the left populist Bernie Sanders surprised the world by coming out on top, with his vote declining virtually in a straight line as town incomes vaulted upward. Figure 1, reproduced here from our earlier essay, said it all:

Figure 1: Lower Income Towns in New Hampshire Voted Heavily for Sanders; Richer Towns Did the Opposite Source: Ferguson, Jorgensen and Chen, 2020
A more vivid example of a split-level political party could hardly be imagined.
Now, four years later, it is the Republican primary that highlights a dramatic economic bifurcation in a major political party. Donald Trump’s vote in New Hampshire is almost a mirror image of the 2020 Democratic outcome: As Figure 2 shows, yet again, as town incomes increased, the vote for the former president plunged.

Figure 2: Trump’s Percentage of the Vote Fell as Town Incomes Rose
The divide is actually more interesting than the figure suggests. A closer look indicates that slow growth over a long period of time compounds the direct influence of income. Teasing that conclusion out of the available data takes some effort, though.
Election returns from the Granite State’s charmingly venerable (to put it politely) voting units are typically reported by “towns.” These come in more shapes and sizes than even many hardened spectators of American elections can easily imagine. All the rabbit warrens turn the state’s electoral map into a crazy quilt of jurisdictions, archaic names, and imperfectly correlated census areas. As a result, timely and reliable contextual data for many voting units is sometimes exasperatingly difficult to locate. For a few small centers, important measures are simply unavailable, even from state websites that sometimes seem almost to flaunt their languidly paced updates.[1]
To approximate election unit growth rates over time, we turned to a stratagem that we have used in previous studies of Trump and American elections: analyzing proportional changes in population growth between 2010 and 2022 – a statistic that is typically available even for hamlets.[2]
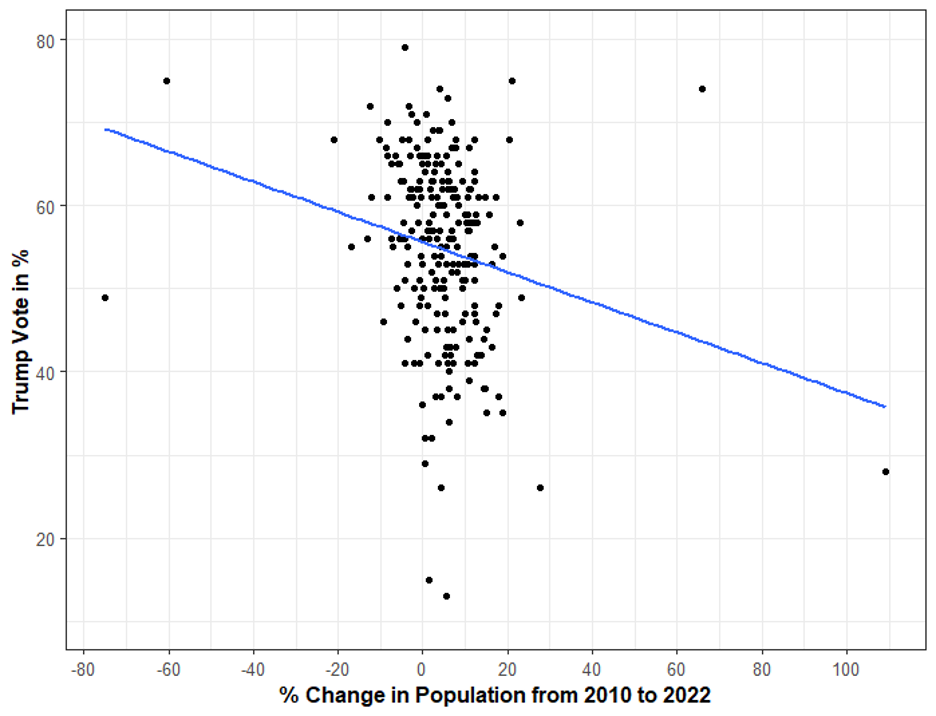
Many New Hampshire towns show little or no growth over that stretch, but there are major outliers, too, so the graph of long-term change in town populations is a bit less stark.[3] But the association of higher Trump voting percentages with slower growth is clear and easily verified. Trump beat Haley in over 80% of towns experiencing negative growth. By contrast, he beat Haley in just over 60% of towns experiencing population growth of over 10%.

Figure 3: The Trump Vote Also Ran Higher in Slower Growing Towns; Faster Growing Areas Tilted More Heavily Against Him
These plots thicken – literally – when you inquire whether the two variables perhaps influence each other – if, for example, income’s effect on the Trump vote might not be constant but vary by town long-term growth rates. Effects of this sort defy easy graphical representation, and so we dispense with any here. But they are readily assessed statistically.
Again, the answer is clear: The combination of the two effects – low incomes and low growth – does indeed add up to more than the sum of the parts. As statisticians say, they interact with each other. Trump tended to do best in slower-growing, low-income towns. His vote fell off in faster-growing, high-income towns. Together the two variables and their interaction can explain about a fifth of the total result. In elections that is a substantial finding.[4]
We draw several conclusions from these results, though we begin with the standard cautions about the dangers of the ecological fallacy: aggregate studies like our’s should not be used to make generalizations about how individuals and subgroups voted. For that, you need data on individuals. For example, voter choices among particular ethnicities or income groups may well vary depending on whether they are scattered across many districts or concentrated in just a few.[5]
But even with that caution, our results suggest some important reasons why the rest of the Republican field fared so poorly against Trump. The financial profile of the Trump campaign has always stood out as a barbell – at one end a mass of small donations; at the other, a weighty golden throne of big money.[6] It was so in 2016 and 2020; and enough evidence is in already to know that 2024 is repeating that pattern, even before the many Republican holdouts who now appear to be reconciling themselves to his nomination finally decide to jump in.[7] By contrast the rest of the Republican field – even the millionaires – had no realistic prospect of winning without massive inflows of funds. They had to chase money and did, with DeSantis and Haley cashing in most heavily.
The focus on attracting major donors had predictable effects on their campaign appeals. The candidates were happy to join Trump in proclaiming global warming to be either a hoax or vastly exaggerated and insisting that “drill, baby, drill’ should be America’s energy policy of choice. Lines like those bring in plenty of money from entirely predictable sources. Trump’s disdain for regulation and government red tape are two more lucrative themes that rock no boats within the GOP. And all of them looked kindly on some kind of “wall” at the border. In this sense, the Republican Party still shares some common core propositions.
But in ways that matter most, it no longer does. The rift between Trump and the Republican Establishment on basic economic policy has always run deep, but now it has widened into a Grand Canyon. The New Hampshire results testify how little many of the also ran’s favorite economic themes – the perils of the deficit, cutting Social Security, or crypto – moved Trump’s core constituency. Large numbers of Trump voters count on Social Security to get by and simply cutting government expenditure can hardly rank as their first priority. Trump bluntly advised Congressional Republicans to leave Social Security alone and his campaign puts the famous MAGA – Making American Great Again – right up front. He talks constantly of rebuilding the industrial base, the virtues of Made in America, and – above all – the urgent need for higher tariffs and more aggressive export policies.
Election analysts underestimate the resonance of these appeals today at their peril, in part because conventional poll questions on trade are so poor. The New Hampshire results are consistent with careful studies of what actually moved individual voters from the earliest days of Trump’s candidacy, when his emphasis on tariffs and economic nationalism stood out in the rest of the Republican field. While the very latest economic numbers look better and the state for sure benefited from programs that the Biden administration has now wound down, the overall economic news for most New Hampshire residents has been grim. As the New Hampshire Fiscal Institute summarized matters in September 2023, “Latest Census Bureau Data Show Median Household Income Fell Behind Inflation, Tax Credit Expirations Increased Poverty.”
Many critics of Trump pay little attention to the details of his actual economic record before Covid hit. They thus miss how his 2024 appeals are drawing force from cultivated memories of how the economy fared on his watch.
It is absolutely true that by historical standards, the time path of economic growth under Trump was not remarkable, even before 2020…. his overall economic policies powerfully reinforced the stark divides of America’s dual economy. But as 2018 turned into 2019 and inflation failed to take off despite story after story in the business press about the difficulties businesses were having finding workers…Wages were hardly rising…[but] in the short run incomes were increasing because people could at last get more hours of relatively low-paid work as employers became more willing to look at people they had previously written off. People were reentering the labor force and even long-term rates of unemployment were falling. It was also easier to find second and third precarious gig jobs if people wanted them … rates of unemployment for Blacks, Hispanics, and other groups fell to historically low levels before the pandemic (Ferguson, Jorgensen, and Chen, 2021).
Voters left behind by decades of globalized finance and production do not miss his message or that his Republican opponents had nothing to offer them.
Other than rhetoric about the “Other.” Here a look at the great arc of the campaign is instructive. DeSantis in particular quite deliberately tried to steal essentially all of Trump’s cultural clothes. He posed as a more effective Trump, someone capable of getting things done while hitting hard on virtually every hot-button cultural issue: He picked a quarrel with Disney and other favorite targets of the right, while filling his campaign with endless dog whistles drawn from hard right racial and gender memes, along with jeremiads about abortion, Covid vaccination, school libraries, and labels on bathroom doors.
But if you want that sort of thing, it is probably impossible to top Trump himself, who is still carrying on about “immigrants poisoning the blood of our country,” even as Democrats worry about the erosion of support among Hispanic voters.
The 2024 race for the presidency is indeed looking peculiar. The 2020 New Hampshire primary illustrated how tensions between big money and the mass base of the Democrats were bringing the Party almost to a point of collapse. But the Biden administration did not make the mistake Hillary Clinton’s campaign did in 2016: it did not ostracize the Sanders wing of the party. Instead, it brought its leaders into many, if far from all its councils, and accepted some of their policy proposals, especially when substantial numbers of big donors also favored them, such as its measures to abate climate change.
This year’s New Hampshire primary testifies to the disintegration of the Republican Party: traditional “country club” Republicanism is dead as a mass force, killed off by its efforts to use dog whistles as a substitute for economic policies that offer something real to the rest of the population in the face of a challenger who owns every dog whistle in sight but also has a forthright alternative economic policy.[8]
How all this plays out in November is anyone’s guess, even if it is true that the whole world really is watching. American politics right now is like late winter ice on a New Hampshire barn roof: It could slide off as easily on the left as on the right or slowly melt down evenly for a long time. The only thing we know for sure is that we do not know. The abortion issue still cuts heavily in favor of the Democrats. But we do not share the widespread confidence that “Team Transitory” has won the argument over inflation. In a globally warming, multipolar world, shocks of all kinds just keep coming, as the latest developments in the Red Sea illustrate. And foreign policy disasters on the scale of 1980, or a bigger border crisis, could restructure American politics in a flash.
Notes
Thanks to Gail Chaddock, James Kurth, and Pia Malaney for very helpful comments.
[1] Our election data come from the New York Times compilation. This was archived some days after the election, so it is nearly, but not quite, complete. But better data is not available in public. We checked the few other inventories we found, but they were inferior. We took town income data from the New Hampshire Department of Environmental Services. This presents U.S. Census data, but it compiles several options for some “towns.” We compared its various entries and tried to use the figures that most closely matched with the unit reporting the returns. In any case, it does not matter; we checked whether different choices mattered. They differ trivially. One omission is worth flagging: There is no entry for median household income for Dixville Notch. We had to omit it. Probably it is an outlier to the generalizations in this paper since its votes went to Haley – all six of them. Most population data came directly from the U.S. Census, but data for all towns was incomplete. We used New Hampshire state websites for particular communities to fill in most of the others. The consequence is inevitably that correlations and regressions differ slightly in the number of cases, depending on whether they refer to income, population change, or both together. The differences are tiny; they can’t materially affect our results.
[2] The economies of contracting population units are typically falling behind; rapidly growing areas are commonly the reverse. That is the logic of using population growth.
[3] Many towns fall between plus or minus 20 percent; the outliers are not that numerous.
[4] The correlation of the Trump vote with income is -.377 and R-squared = .142, with an is N = 234; for the population change between 2010 and 2022, N = 237 and the correlation = -.210, with an R-squared = .044. A regression on both variables and their interaction produces an adjusted R squared of .177 with all terms significant at an .01 level. We checked for spatial correlation, but our Moran tests indicated no adjustment was needed. It goes without saying that if we had more variables, the equation would improve.
[5] On the other hand, New Hampshire is, by comparison with many states, relatively homogenous, as we noted in our older essay on Sanders.
[6] For 2016, see Figure 8 of Ferguson, Jorgensen, and Chen, 2022 and the references there. We are finishing a study of 2020, but the shape has been obvious all along. See, for example, the discussion of private equity’s support for Trump in Ferguson, Jorgensen, and Chen, 2021.
[7] We will return to this question in the near future.
[8] The economic and political effects of Trump’s tariffs are highly debated, Our earlier analysis, however, appears to hold up very well, though the subject is too complex to treat here.
Photo: Trump at a rally in Rochester, NH on Jan 23, 2024. Credit: Liam Enea / Flickr (Creative Commons License)


